05.05.25 Morning ForecastPairs on Watch -
FX:USDCHF
FX:AUDUSD
FX:AUDCAD
FOREXCOM:COFFEE
A short overview of the instruments I am looking at for today, multi-timeframe analysis down to what I will be looking at for an entry. Enjoy!
W-patterns

XAU/USD Market Outlook – Key Levels & Scenarios (May 2025)📊 Market Overview
Asset: XAU/USD (Gold vs. USD) – likely
Timeframe: 🕒 4H or Daily
EMAs:
🔴 50 EMA = 3,281 (short-term trend)
🔵 200 EMA = 3,179 (long-term trend)
🧱 Key Zones
🔺 Main Resistance Zone (🚫 Supply Area)
📍 ~3,320–3,400
🔍 Observation: Strong rejection zone with multiple failed attempts. 🚧 Price struggles to break and hold above here.
⚖️ Mid Support & Resistance Zone
📍 ~3,200–3,250
🧭 Current Action: Price is consolidating here. This is a key decision zone. A bounce or breakdown will likely decide the next big move. 🤔
🟦 Main Support Zone
📍 ~2,980–3,030
🛑 Observation: Major demand zone. If price falls here, it might attract buyers 👥 for a potential rebound.
📉 EMA Analysis
🔴 50 EMA is above 🔵 200 EMA → Trend still technically bullish ✅
🟡 BUT: Price is currently below 50 EMA, showing short-term weakness ⚠️
⚡️ 200 EMA is nearby (~3,179): Acting as dynamic support — a critical bounce zone! 🛡️
🔮 Scenarios
🐂 Bullish Path
✅ If price bounces from 3,200 support zone and reclaims 🔴 50 EMA:
🎯 Target: Retest of 3,320–3,400 🔺 zone
📈 Confirmation: Strong candle closing above 3,281 🔴 EMA
🐻 Bearish Path
🚨 If price breaks below 3,200 & 200 EMA:
🕳️ Expect drop towards 2,980–3,030 🟦 zone
📉 Confirmation: Candle closes below 3,179 with weak retest
✅ Conclusion
📍 Key Level to Watch: 3,200
⚖️ Market Sentiment: Neutral → Bearish bias unless price reclaims 50 EMA
🔒 Risk Tip: Avoid longs until price confirms bullish structure again 🔐

A Bitcoin Prediction (2025)In this chart, we continue the journey of testing whether Bitcoin can live up to the expectations as published in my previous Bitcoin prediction chart (2024). Since we had technically hit my ATH cycle top for 2024–25, we are now gambling with the possibility that we might not have hit the highest cycle top targets and may just extend that little bit more. I think 2025 has most people asking, "Are we done yet?" or are we on the verge of something else? We'll just have to wait and see....
Upside:
As you can see in ATHs, there are several targets, and I've mentioned this in my previous chart. Ultimately, the high side of what this chart can expect from a cycle high is a 2-week close of $131k. Wicks can extend beyond this price, but I expect a close below (according to this chart). A close above will invalidate this chart. All prices within the lows and highs are acceptable.
Downside:
In my previous chart, I hadn't posted any projected targets during a bear market; I only highlighted the lows, as generally that is what most may consider important enough to know—when can we resume the bull market again? Well, in this chart, I have labeled two additional downside targets. Although these do not follow the same pattern as other targets, they do have a significant similarity to previous cycle lows. Expect bounces from these levels, but if the pattern holds true, they will fail and continue to lower prices. In the short term, resistance sits at $98,511, and again this is on a 2-week close. So this next week, we can wick above, which might be the path we are on.
Summary: I'll be posting updates close to each 2 week close, if I see something I'll be sure to post and update.
2024 Chart linked below.

AI16Z Forming Cup and Handle Pattern🚨 $AI16Z Forming Cup and Handle Pattern 🚨
$AI16Z is forming a cup and handle pattern and is currently waiting for a breakout above the red resistance zone. If the breakout is confirmed, the target will be the green line level.
📈 Technical Overview:
Pattern: Cup and Handle
Resistance Zone: Red area currently being tested.
🎯 Breakout Target: Green line level upon confirmation.

Mastering chart patterns - How to use them in trading!Chart patterns are visual formations created by the price movements of a financial asset—like a stock, currency, or cryptocurrency, on a price chart. Traders use these patterns in technical analysis to predict future market direction based on historical behavior. The main chart patterns are the reversal and continuation patterns.
-------------------------------
What will we discuss?
- Bullish reversal patterns
- Bearish reversal patterns
- Bullish continuation patterns
- Bearish continuation patterns
-------------------------------
Bullish reversal patterns:
Double bottom
A double bottom in trading is a bullish reversal pattern that signals the potential end of a downtrend and the beginning of an uptrend. It forms when the price of an asset falls to a low, bounces back up, then drops again to roughly the same low before rising once more. This creates a "W" shape on the chart.
How to trade it:
Before entering a trade, wait for the price to break back above the neckline with strong volume, as this indicates a potential bullish reversal. Once the breakout is confirmed, look for an entry on the pullback to the neckline.
Inverted head and shoulders
An inverted head and shoulders is a bullish reversal pattern that typically forms after a downtrend and signals a possible shift to an uptrend.
It consists of three parts:
* The left shoulder, where the price makes a low and then bounces.
* The head, which is a deeper low followed by another bounce.
* The right shoulder, a higher low similar in level to the left shoulder.
How to trade it:
Before entering a trade, wait for the price to break above the neckline with strong volume, as this confirms the pattern and signals a potential upward move. After the breakout, it's important to wait for a retest of the neckline to look for an entry. Traders typically place a stop-loss just below the right shoulder to manage risk.
Falling wedge
A falling wedge is a bullish chart pattern that often signals a potential reversal or continuation of an uptrend, depending on where it forms in a price trend.
It appears when the price is moving lower but within a narrowing range, creating two downward-sloping, converging trendlines. Both the highs and lows are falling, but the lower highs are coming down faster than the lower lows, which shows that selling pressure is losing strength over time.
How to trade it:
Wait for the falling wedge to break above the downward trendline and for the price to reclaim the most recent lower high. A breakout alone isn’t always reliable, sometimes the price moves briefly above the trendline without making a higher high, resulting in a fake-out. To confirm the move, wait for a clear higher high and then look to enter on the retracement that follows.
-------------------------------
Bearish reversal patterns
Double top
A double top is a bearish reversal pattern that signals a potential shift from an uptrend to a downtrend.
It forms when the price reaches a high, pulls back, then rallies again to the same or similar high but fails to break above it. This creates an "M" shape on the chart. The neckline is the support level at the low point between the two peaks. When the price breaks below this neckline with strong volume, it confirms the pattern and suggests that selling pressure is taking over.
How to trade it:
Before entering a trade, wait for the price to break below the neckline with strong volume, as this indicates a potential bearish reversal. Once the breakout is confirmed, look for an entry on the pullback to the neckline.
Head and shoulders
A head and shoulders is a bearish reversal pattern that typically forms after an uptrend and signals a potential shift to a downtrend.
It consists of three peaks:
* The left shoulder, where the price rises and then falls.
* The head, which is a higher peak followed by another decline.
* The right shoulder, a lower high that is roughly equal in height to the left shoulder.
How to trade it:
Before entering a trade, wait for the price to break below the neckline with strong volume, as this confirms the pattern and signals a potential downside move, After the breakout, it’s important to wait for a retest of the neckline to look for an entry. Traders typically place a stop-loss just above the right shoulder to manage risk
Rising wedge
A rising wedge is a bearish chart pattern that often signals a potential reversal or continuation of an downtrend, depending on where it forms in a price trend.
It appears when the price is moving higher but within a narrowing range, creating two upward-sloping, converging trendlines. Both the highs and lows are rising, but the highs are increasing at a faster rate than the lows. This suggests that buying pressure is weakening over time, and the market may be preparing for a downturn.
How to trade it:
Wait for the rising wedge to break below the upsloping trendline and for the price to reclaim the most recent high low. A breakout alone isn’t always reliable, sometimes the price moves briefly below the trendline without making a lower low, resulting in a fake-out. To confirm the move, wait for a clear lower low and then look to enter on the retracement that follows.
-------------------------------
Bullish continuation patterns
Bullflag
A bull flag is a continuation pattern that signals the potential for a price to continue moving upward after a brief consolidation or pullback.
It forms when the price experiences a strong upward move (the flagpole), followed by a period of consolidation or a slight downward movement (the flag). The flag typically slopes downward or moves sideways, and the consolidation phase usually occurs within two parallel trendlines, creating a rectangle or slight downward channel.
How to trade it?
Before entering a position, wait for the price to break above the downsloping trendline and establish a higher high. If the price doesn’t make a higher high, it could be a fake-out. Once a higher high is confirmed, look for an entry on the retracement. The target is typically the length of the flagpole projected upward from the breakout point.
Bullish pennant
A bullish pennant is a continuation pattern that indicates the potential for a price to continue its upward trend after a brief consolidation. It forms when a strong upward move (the flagpole) is followed by a period of consolidation, where the price moves within converging trendlines, creating a small symmetrical triangle or pennant shape. The consolidation typically shows lower highs and higher lows, and the pattern suggests that the market is taking a "breather" before continuing its upward momentum.
How to trade it?
Before entering a position, wait for the price to break above the downsloping trendline and establish a higher high. If the price doesn’t make a higher high, it could be a fake-out. Once a higher high is confirmed, look for an entry on the retracement. The target is typically the length of the flagpole projected upward form the breakout point.
Ascending triangle
An ascending triangle is a bullish continuation pattern that typically forms during an uptrend, signaling that the price is likely to continue moving higher.
It is characterized by a horizontal resistance line at the top, formed by a series of peaks at roughly the same price level, and an ascending support line at the bottom, formed by higher lows. This creates a triangle shape, where the price is gradually compressing between the horizontal resistance and the rising support.
How to trade it?
Before entering a position, wait for the price to break above the horizontal resistance level with strong volume. Once the breakout occurs, look for an entry on the retracement back to this area.
-------------------------------
Bearish continuation patterns
Bearflag
A bear flag is a bearish continuation pattern that suggests the price is likely to continue moving downward after a brief consolidation or upward pullback.
It forms when there is a strong downward move (the flagpole), followed by a period of consolidation or slight upward movement (the flag). The flag typically slopes upward or moves sideways, and the consolidation occurs within two parallel trendlines, creating a rectangular or upward-sloping channel. This pattern shows that, despite the short-term pullback, the overall downtrend remains intact.
How to trade it?
Before entering a position, wait for the price to break below the upsloping trendline and establish a lower low. If the price doesn’t make a lower low, it could be a fake-out. Once a lower low is confirmed, look for an entry on the retracement. The target is typically the length of the flagpole projected downward for the breakout point.
Bearish pennant
A bearish pennant is a bearish continuation pattern that signals a potential continuation of a downtrend after a brief consolidation.
It forms when there is a strong downward move (the flagpole), followed by a period of consolidation where the price moves within converging trendlines, creating a small symmetrical triangle or pennant shape. The consolidation typically shows lower highs and higher lows, indicating that the price is taking a pause before continuing its downward movement.
How to trade it?
Before entering a position, wait for the price to break below the upsloping trendline and establish a lower low. If the price doesn’t make a lower low, it could be a fake-out. Once a lower low is confirmed, look for an entry on the retracement. The target is typically the length of the flagpole projected downward for the breakout point.
Descending triangle
A descending triangle is a bearish continuation pattern that typically forms during a downtrend, indicating that the price is likely to continue moving lower after a period of consolidation.
The pattern is characterized by a horizontal support line at the bottom, formed by a series of lows at approximately the same price level, and a descending resistance line at the top, formed by a series of lower highs. The price contracts between these two trendlines, creating a triangle shape with a downward-sloping upper boundary and a flat lower boundary.
How to trade it?
Before entering a position, wait for the price to break below the horizontal support level with strong volume. Once the breakout occurs, look for an entry on the retracement back to this area.
-------------------------------
Thanks for your support.
- Make sure to follow me so you don't miss out on the next analysis!
- Drop a like and leave a comment!

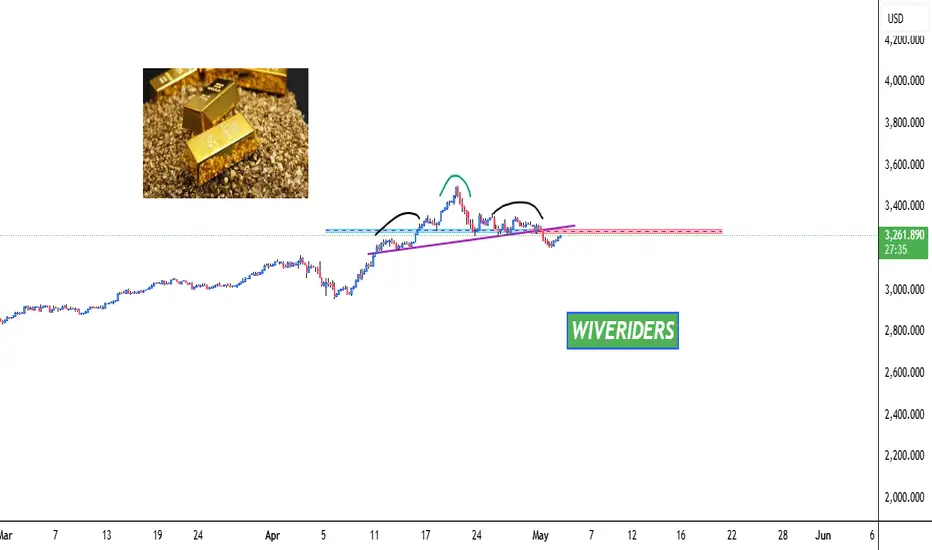
GOLD Formed Bearish Head and Shoulders Pattern🚨 TVC:GOLD Formed Bearish Head and Shoulders Pattern 🚨
TVC:GOLD has formed a bearish head and shoulders pattern and appears to be making a pullback to the neckline before a potential drop. However, if the price breaks out above the right shoulder, the bearish pattern could be invalidated.
📈 Technical Overview:
Pattern: Bearish Head and Shoulders
Neckline: Current pullback area.
Bearish Confirmation: A drop below the neckline could confirm the bearish move.
Invalidation: If the price breaks out above the right shoulder, the bearish pattern may be invalidated.
02.05.25 Morning ForecastPairs on Watch -
OANDA:XAGUSD
FX:AUDJPY
FX:EURUSD
A short overview of the instruments I am looking at for today, multi-timeframe analysis down to what I will be looking at for an entry. Enjoy!

ascending triangle patternSEED_DONKEYDAN_MARKET_CAP:ILV is forming an ascending triangle pattern and is approaching a key red resistance zone. If the price breaks out above this level with confirmation, the target will be the green line level.
📈 Technical Overview:
Pattern: Ascending Triangle
Resistance Zone: Red area currently being tested.
🎯 Breakout Target: Green line level upon confirmation.

01.05.25 Morning ForecastPairs on Watch -
GBP / JPY
GBP / CHF
XAG / USD
NZD / CAD
A short overview of the instruments I am looking at for today, multi-timeframe analysis down to what I will be looking at for an entry. Enjoy!

30.04.25 Morning ForecastPairs on Watch -
GBP / AUD
AUD / JPY
GBP / JPY
EUR / USD
A short overview of the instruments I am looking at for today, multi-timeframe analysis down to what I will be looking at for an entry. Enjoy!

WLD Bearish Head and Shoulders Pattern ConfirmedWLD Bearish Head and Shoulders Pattern Confirmed 🚨
WLD has formed a bearish head and shoulders pattern and is currently breaking below the red neckline. The target for this bearish move is the green line level.
📈 Technical Overview:
Pattern: Bearish Head and Shoulders
Neckline: Red level, currently being broken.
🎯 Target: Green line level.
.

Testing Purple Resistance Zone 🚨 CRYPTOCAP:XRP Testing Purple Resistance Zone 🚨
CRYPTOCAP:XRP is currently testing a significant purple resistance zone. A breakout above this level could signal a bullish move, with the first target at the green line level. Keep an eye on the price action for confirmation.
📈 Technical Overview:
Resistance Zone: Purple area currently being tested.
🎯 Breakout Target: Green line level upon confirmation.

29.04.25 Morning ForecastPairs on Watch -
GBPJPY
AUDUSD
EURUSD
A short overview of the instruments I am looking at for today, multi-timeframe analysis down to what I will be looking at for an entry. Enjoy!

Gambling Is Not Trading : A Quick Reminder to THINKI've been getting quite a few messages from followers and many are positive. I seems my videos are helping many of you learn better skills and helping you find profits from these bigger price swings.
But it also seems some of you are really gambling for the bigger gains with 0DTE options and taking excessive risks (IMO).
I want to urge all of you to THINK and to try to learn to adopt a more fluid style of trading.
The markets will quickly humble many of you gamblers. They have a way of taking everything you have when you let your guard down.
Start Small.
Build Your Skills.
Learn How To Check Yourself When You Get Into That Gambling Mode.
Remember, The Market Can Take EVERYTHING (And MORE).
The trick to trading is to learn to GROW your account without gambling. It is like being a Sniper.
You have to learn when to take your shot and you also have to learn when to be patient and wait.
One of the best pieces of advice I've heard came from a friend (who trades options). He stated.
Start Small
Book Winners Quickly
Book Anything over 20-25%
-- Then Plan For The next Attack.
Think about it.
He's been trading for more than 20 years and has learned many of the pitfalls over that time. And, he is the one guy that I've seen generate 100-200%+ a week (consistently) over the past 2+ years.
If you want to survive as a trader, you have to start thinking like a trader (not a GAMBLER).
I hope this video helps.
Get some.
#trading #research #investing #tradingalgos #tradingsignals #cycles #fibonacci #elliotwave #modelingsystems #stocks #bitcoin #btcusd #cryptos #spy #gold #nq #investing #trading #spytrading #spymarket #tradingmarket #stockmarket #silver

28.04.25 Morning ForecastPairs on Watch -
FX:EURNZD
FX:GBPCHF
FX:USDCHF
FX:EURUSD
A short overview of the instruments I am looking at for today, multi-timeframe analysis down to what I will be looking at for an entry. Enjoy!

25.04.25 Morning ForecastPairs on Watch -
FX:EURNZD
FX:USDCHF
FX:EURUSD
A short overview of the instruments I am looking at for today, multi-timeframe analysis down to what I will be looking at for an entry. Enjoy!

1000SAT Trade Setup – Neckline Retest📊 1000SAT Trade Setup – Neckline Retest 📈
🔹 Current Action: Pulling back to Green Neckline (Inverted H&S) 🟢
✅ Confirmation: Break & Close Above Red Resistance Zone 🔴
🎯 Target: Green Line Level 🚀
⚠️ Invalidation: Breakdown Below Green Neckline 👇

24.04.25 Morning ForecastPairs on Watch -
FX:AUDUSD
FX:NZDCAD
FX:USDJPY
A short overview of the instruments I am looking at for today, multi-timeframe analysis down to what I will be looking at for an entry. Enjoy!

cup with handle pattern on the 1-hour time frameWelcome to today's analysis! Let’s break down the current price action on NASDAQ:NVDA and potential trade setups.
🌐 Overview: NASDAQ:NVDA Forming a Cup with Handle Pattern
📈 NASDAQ:NVDA is currently forming a cup with handle pattern on the 1-hour time frame. This pattern is typically bullish and could indicate a potential upward move.
🔄 Current Scenario:
NASDAQ:NVDA has formed a cup shape and is now developing the handle. The handle is a consolidation phase before a potential breakout.
The key level to watch is the resistance at the top of the handle. A breakout above this level could signal a bullish continuation.
🔑 Key Levels to Watch
🔴 Resistance: Top of the Handle (Needs breakout for continuation)
🟢 Target: Measured move equal to the depth of the cup, projected from the breakout point.
🛠️ Trade Scenarios
📌 Bullish Scenario (Breakout Above Resistance)
If NASDAQ:NVDA breaks and holds above the handle resistance, it could move toward the target level.
This breakout would confirm the cup with handle pattern and suggest a potential upward trend.
📌 Bearish Scenario (Failure to Breakout)
If NASDAQ:NVDA fails to break out and instead moves lower, it could retest the support levels within the cup or handle.
A failure to hold above key support levels could indicate a potential reversal or further consolidation.
📌 Conclusion
NASDAQ:NVDA is forming a cup with handle pattern on the 1-hour time frame. A breakout above the handle resistance could signal a bullish move toward the target level. If the price fails to break out, further consolidation or a retest of support levels may be necessary.

23.04.25 Morning ForecastPairs on Watch -
FX:GBPAUD
FX:AUDCAD
FX:USDCHF
A short overview of the instruments I am looking at for today, multi-timeframe analysis down to what I will be looking at for an entry. Enjoy!

22.04.25 Morning ForecastPairs on Watch -
FX:AUS200
FX:AUDUSD
FX:EURUSD
FX:GBPUSD
A short overview of the instruments I am looking at for today, multi-timeframe analysis down to what I will be looking at for an entry. Enjoy!

Bullish Rounding Bottom!📈 GHST Update – Bullish Rounding Bottom! 🚀
👀 GHST has formed a bullish rounding bottom. If breakout red resistance zone target green line level.
🔑 We are waiting for a breakout above the red resistance zone to target the green line level.
Keep a close eye on GHST!

18.04.25 Morning ForecastPairs on Watch -
FX:NZDUSD
FX:AUDUSD
FX:EURNZD
FX:USDJPY
A short overview of the instruments I am looking at for today, multi-timeframe analysis down to what I will be looking at for an entry. Enjoy!
