WALMART 1W MA50 rebound makes a solid long-term investment.Walmart (WMT) ended its 2 month correction with an emphatic rebound on its 1W MA50 (blue trend-line). This is the first time it touches the 1W MA50 since December 11 2023 but it's not uncommon at all within its 10-year Channel Up.
Every time the stock hi its 1W MA50 while the 1W RSI was this low, it was the most common long-term buy opportunity. Better than that was only the one time it hit the 1W MA200 (orange trend-line) during the 2022 Inflation Crisis.
As a result, we expect at least a 2.0 Fibonacci extension rebound similar to the May 2018 Low, and our long-term Target is now $135.00.
-------------------------------------------------------------------------------
** Please LIKE 👍, FOLLOW ✅, SHARE 🙌 and COMMENT ✍ if you enjoy this idea! Also share your ideas and charts in the comments section below! This is best way to keep it relevant, support us, keep the content here free and allow the idea to reach as many people as possible. **
-------------------------------------------------------------------------------
💸💸💸💸💸💸
👇 👇 👇 👇 👇 👇
Walmartsignals

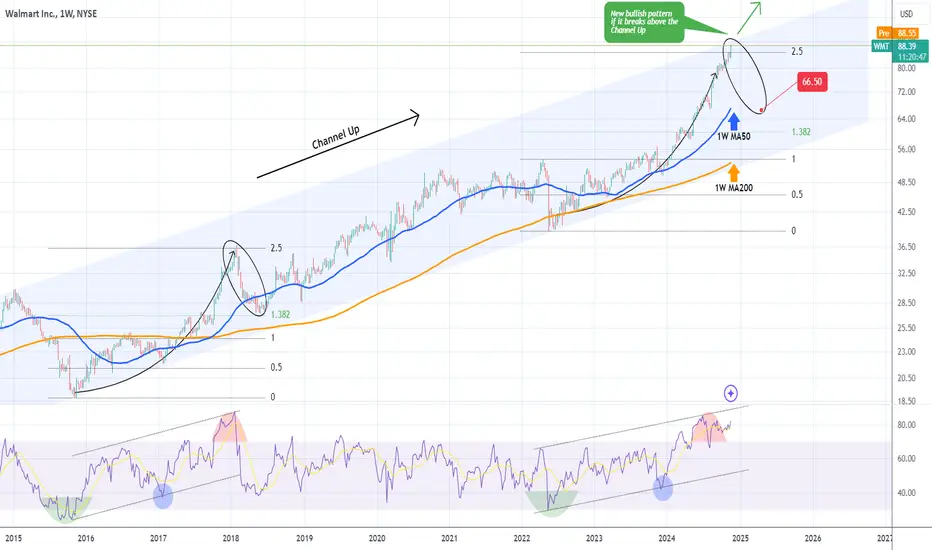
WALMART on top of 10-year Channel. Correction or break-out?Walmart (WMT) has been trading within a 10-year Channel Up pattern since the January 12 2015 High. The price has finally reached the top (Higher Highs trend-line) of this decade-long bullish pattern and that is easily identifiable by the 1W RSI sequence.
The rally that started on the May 16 2022 bottom is very similar to the one that started on the October 26 2015 bottom. The two fractals initially started rebounding and on the first 0.5 Fibonacci test, they held it and entered a more aggressive rally, supported by the 1W MA50 (blue trend-line).
The past one peaked just above the 2.5 Fibonacci extension (January 29 2018). The current week has put us above the 2.5 Fib ext and right at the top of the Channel Up. If it replicates the Jan - May 2018 correction, it could test $66.50. If it closes above the Channel Up though, a new bullish pattern will emerge and we will re-evaluate with the price action we get at that time. However it is easily understandable that having an SL at the top is worth taking the short's risk as the potential reward is much greater than the risk. And if it fails the loss is minimal and we can still follow the bullish trend with a break-out buy.
-------------------------------------------------------------------------------
** Please LIKE 👍, FOLLOW ✅, SHARE 🙌 and COMMENT ✍ if you enjoy this idea! Also share your ideas and charts in the comments section below! This is best way to keep it relevant, support us, keep the content here free and allow the idea to reach as many people as possible. **
-------------------------------------------------------------------------------
💸💸💸💸💸💸
👇 👇 👇 👇 👇 👇
WALMART Short-term correction on the wayLast time we looked at Walmart (WMT) we gave a solid sell signal (March 27, see chart below), which served as a pull-back step for the stock's amazing recent Bullish Leg:
This time, the Channel Up it's been trading on is more aggressive, with each Bullish Leg posting rallies of +22% and 23.60% and bottoms made only just under the 1D MA50 (blue trend-line), presenting easy buy opportunities.
As the moment, the price is already on the Channel's top (Higher Highs trend-line), having completed a +22% rise and technically the maximum it can go to is +23.60%. As a result, we expect a short-term correction now of at least -6.40% (similar to the last one). We estimate that to be around $77.00 and once the 1D MA50 breaks again, we will get our new buy opportunity, possibly on the 4th candle after the break.
-------------------------------------------------------------------------------
** Please LIKE 👍, FOLLOW ✅, SHARE 🙌 and COMMENT ✍ if you enjoy this idea! Also share your ideas and charts in the comments section below! This is best way to keep it relevant, support us, keep the content here free and allow the idea to reach as many people as possible. **
-------------------------------------------------------------------------------
💸💸💸💸💸💸
👇 👇 👇 👇 👇 👇

WALMART RSI Bearish Divergence points to $58.00Walmart (WMT) has been trading within a Channel Up pattern since the May 20 2022 Low. The current Bullish Leg is approaching the pattern's top (Higher Highs trend-line) and the probability for a correction becomes greater on every up move.
As the 1D RSI has been on a Bearish Divergence since February 20, similar to the April - May 2023 Divergence, we are expecting a symmetrical decline of roughly -6.00%. That gives us a short Target of $58.00.
-------------------------------------------------------------------------------
** Please LIKE 👍, FOLLOW ✅, SHARE 🙌 and COMMENT ✍ if you enjoy this idea! Also share your ideas and charts in the comments section below! This is best way to keep it relevant, support us, keep the content here free and allow the idea to reach as many people as possible. **
-------------------------------------------------------------------------------
💸💸💸💸💸💸
👇 👇 👇 👇 👇 👇

WALMART may be approaching the end of this rallyWalmart Inc. (WMT) has been rising since the low of the June 13 2022 weekly (1W) candle. Along the way it broke above the key Resistance of the 1W MA50 (blue trend-line) and after it held the 1W MA200 (orange trend-line), it has established both as Support levels long-term.
There are however two longer term patterns to consider that supersede those MA periods, and those are the Megaphone pattern since November 2020 and the Higher Lows trend-line/ Zone since November 09 2015.
As the 1W RSI enters the Resistance zone that is holding since 2016 and only broke once, we have to start considering that the top is near especially as the price is approaching the Higher Lows zone of the Megaphone. As you see since 2016, every major test of the 1W RSI Resistance Zone hit at least the 1W MA50. This suggests that if you bought Walmart a few weeks back, you may start looking to book profits and re-buy lower either on the 1W MA50 or even a little lower, the closer to the Higher Lows trend-line, the better.
If the price breaks first above the Megaphone's top (Higher Highs trend-line), it is an instant buy and a new bullish pattern will emerge.
-------------------------------------------------------------------------------
** Please LIKE 👍, SUBSCRIBE ✅, SHARE 🙌 and COMMENT ✍ if you enjoy this idea! Also share your ideas and charts in the comments section below! This is best way to keep it relevant, support me, keep the content here free and allow the idea to reach as many people as possible. **
-------------------------------------------------------------------------------
You may also TELL ME 🙋♀️🙋♂️ in the comments section which symbol you want me to analyze next and on which time-frame. The one with the most posts will be published tomorrow! 👏🎁
-------------------------------------------------------------------------------
💸💸💸💸💸💸
👇 👇 👇 👇 👇 👇
