GOLD 1H CHART ROUTE MAP & TRADING PLAN FOR THE WEEKHey Everyone,
Please see our updated 1h chart levels and targets for the coming week.
We are seeing price play between two weighted levels with a gap above at 2922 and a gap below at 2901. We will need to see ema5 cross and lock on either weighted level to determine the next range.
We will see levels tested side by side until one of the weighted levels break and lock to confirm direction for the next range.
We will keep the above in mind when taking buys from dips. Our updated levels and weighted levels will allow us to track the movement down and then catch bounces up.
We will continue to buy dips using our support levels taking 30 to 40 pips. As stated before each of our level structures give 20 to 40 pip bounces, which is enough for a nice entry and exit. If you back test the levels we shared every week for the past 24 months, you can see how effectively they were used to trade with or against short/mid term swings and trends.
BULLISH TARGET
2922
EMA5 CROSS AND LOCK ABOVE 2922 WILL OPEN THE FOLLOWING BULLISH TARGET
2947
EMA5 CROSS AND LOCK ABOVE 2947 WILL OPEN THE FOLLOWING BULLISH TARGET
2968
BEARISH TARGETS
2901
EMA5 CROSS AND LOCK BELOW 2901 WILL OPEN THE FOLLOWING RETRACEMENT RANGE
2878 - 2851
EMA5 CROSS AND LOCK BELOW 2851 WILL OPEN THE SWING RANGE
SWING RANGE
2820 - 2796
As always, we will keep you all updated with regular updates throughout the week and how we manage the active ideas and setups. Thank you all for your likes, comments and follows, we really appreciate it!
Mr Gold
GoldViewFX
Xauusd(w)

GOLD WEEKLY CHART MID/LONG TERM ROUTE MAPHey Everyone,
Please see update on the weekly chart idea we have been tracking for over a month now and still playing out, as analysed.
Previously we stated that after completing 2856 target, we were left with body close above 2856 leaving a gap to 2976 but needed ema5 lock to further confirm this although we already took over 700 pips on the run, as its a big gap to chase in one go.
- We now have the ema5 lock to further confirm the long range gap above. If we see any rejections here due to volatility and news, then we would continue to look for the channel top for support for an ascending movement up, slowly over a longer term into our long range gap. Once again we prove the safest way to chase this Bull in this range is from dips.
This is the beauty of our channels, which we draw in our unique way, using averages rather than price. This enables us to identify fake-outs and breakouts clearly, as minimal noise in the way our channels are drawn.
Thank you all for your likes, comments and follows, we really appreciate it!
Mr Gold
GoldViewFX

GOLD 4H CHART ROUTE MAP & TRADING PLAN FOR THE WEEKHey Everyone,
Please see our updated 4h chart levels and targets for the coming week.
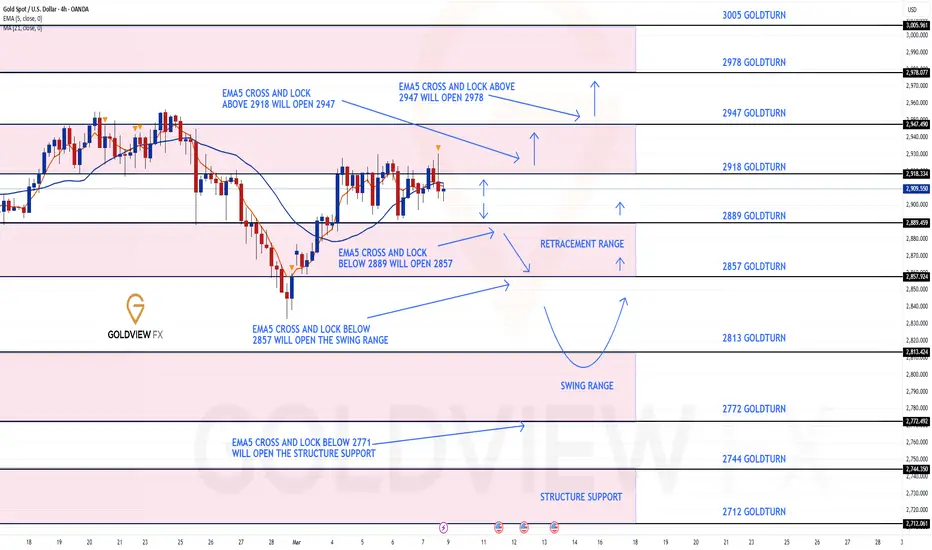
We are seeing price play between two weighted levels with a gap above at 2918 and a gap below at 2889. We will need to see ema5 cross and lock on either weighted level to determine the next range.
We will see levels tested side by side until one of the weighted levels break and lock to confirm direction for the next range.
We will keep the above in mind when taking buys from dips. Our updated levels and weighted levels will allow us to track the movement down and then catch bounces up.
We will continue to buy dips using our support levels taking 30 to 40 pips. As stated before each of our level structures give 20 to 40 pip bounces, which is enough for a nice entry and exit. If you back test the levels we shared every week for the past 24 months, you can see how effectively they were used to trade with or against short/mid term swings and trends.
BULLISH TARGET
2918
EMA5 CROSS AND LOCK ABOVE 2918 WILL OPEN THE FOLLOWING BULLISH TARGET
2947
EMA5 CROSS AND LOCK ABOVE 2947 WILL OPEN THE FOLLOWING BULLISH TARGET
2978
BEARISH TARGETS
2889
EMA5 CROSS AND LOCK BELOW 2889 WILL OPEN THE FOLLOWING BEARISH TARGET
2857
EMA5 CROSS AND LOCK BELOW 2857 WILL OPEN THE SWING RANGE
SWING RANGE
2813 - 2772
As always, we will keep you all updated with regular updates throughout the week and how we manage the active ideas and setups. Thank you all for your likes, comments and follows, we really appreciate it!
Mr Gold
GoldViewFX
XAU/USD (Gold) Trendline Breakout (10.03.2025)The XAU/USD Pair on the M30 timeframe presents a Potential Selling Opportunity due to a recent Formation of a Trendline Breakout Pattern. This suggests a shift in momentum towards the downside in the coming hours.
Possible Short Trade:
Entry: Consider Entering A Short Position around Trendline Of The Pattern.
Target Levels:
1st Support – 2877
2nd Support – 2860
🎁 Please hit the like button and
🎁 Leave a comment to support for My Post !
Your likes and comments are incredibly motivating and will encourage me to share more analysis with you.
Best Regards, KABHI_TA_TRADING
Thank you.

GOLD DAILY CHART MID/LONG TERM UPDATEHey Everyone,
This is an update on our daily chart idea that we are now tracking for a while now. If you have only started following us, please read the updates below from last week.
The half line of our unique channel gave the perfect bounce into the next axis target at 2904, inline with our plans to buy dips just like we stated. We now have a body close once again with ema5 cross and lock above 2904 leaving the range above open. We will continue to look for support at the ascending half-line of the channel, as we climb into the range.
This is the beauty of our Goldturn channels, which we draw in our unique way, using averages rather than price. This enables us to identify fake-outs and breakouts clearly, as minimal noise in the way our channels are drawn.
We will use our smaller timeframe analysis on the 1H and 4H chart to buy dips from the weighted Goldturns for 30 to 40 pips clean. Ranging markets are perfectly suited for this type of trading, instead of trying to hold longer positions and getting chopped up in the swings up and down in the range.
We will keep the above in mind when taking buys from dips. Our updated levels and weighted levels will allow us to track the movement down and then catch bounces up using our smaller timeframe ideas.
Our long term bias is Bullish and therefore we look forward to drops like this from rejections, which allows us to continue to use our smaller timeframes to buy dips using our levels and setups.
Buying dips allows us to safely manage any swings rather then chasing the bull from the top.
Thank you all for your likes, comments and follows, we really appreciate it!
Mr Gold
GoldViewFX
LAST WEEKS UPDATE
After completing our Bullish targets we stated that the channel top will act as resistance confirmed with ema5 rejection. A break of the channel top with ema5 would confirm a continuation and failure would confirm rejection. This allowed us to identify true breakouts against fake outs.
We also stated that we need to keep in mind the channel half line below to establish floor to provide support for the range, should we continue to track further up. A break below the half line will open the lower part of the channel to establish floor on the channel bottom. The safest way to track this movement is by buying dips.
- Once again this played out perfectly as we got the rejection on the channel top followed with the channel half line test, which gave the perfect bounce like we stated. We will now either look for a continuation from this bounce or a cross and lock below the half line for a break into the lower channel floor.

HelenP. I Gold will correct to support level and then rebound upHi folks today I'm prepared for you Gold analytics. Looking at the chart, we can see that the price initially climbed near the trend line before reaching Support 2, which aligned with the support zone. After this move, it reversed and dropped back to the trend line, then rebounded and eventually broke through Support 2. The price then made a retest and continued to rise, eventually reaching Support 1, which also coincided with another support zone. Shortly after, XAU broke this level and started consolidating around it. At some point, Gold attempted to push higher but later reversed, dropping back to the trend line and breaking Support 1. However, it quickly rebounded, surging back to the support zone and even higher, breaking Support 1 once again. Currently, the price is trading near this area, and I anticipate that XAUUSD will decline toward the support level before reversing and rebounding upward. In this scenario, my goal is set at 2960 points. If you like my analytics you may support me with your like/comment ❤️

Gold can reach seller zone and then drop to support levelHello traders, I want share with you my opinion about GOLD. Looking at this chart, we can observe how the price moved within an upward channel before reaching the resistance line and making a corrective move down to the support line. After that, Gold climbed to the support level, which aligned with the buyer zone, and eventually broke through, exiting the channel. Following this breakout, XAU began trading within a range, briefly pulling back to the buyer zone before resuming its upward movement. Shortly after, Gold reached the seller zone and consolidated there for some time, as this area coincided with the upper boundary of the range. Later, the price made a correction down to the support level before reversing direction. Since then, the price has been rising steadily, and at this point, it remains in an uptrend. Given this setup, I expect Gold to re-enter the seller zone before initiating a decline toward the support level, which aligns with the lower boundary of the range. Based on this, my target is set at the 2850 support level. Please share this idea with your friends and click Boost 🚀

GOLD(XAUUSD) -Weekly forecast,Technical Analysis & Trading IdeasMidterm forecast:
2772.38 is a major support, while this level is not broken, the Midterm wave will be uptrend.
Technical analysis:
If resistance at 2955 can prevent further price increases, a price drop to 2833 and ultimately the buying zone of 2790 is expected.
If gold can break the resistance at 2955, the price could reach $3,000 or even $350.
Take Profits:
2833.00
2879.11
2955.00
3000.00
3050.00
__________________________________________________________________
❤️ If you find this helpful and want more FREE forecasts in TradingView,
. . . . . . . . Hit the 'BOOST' button 👍
. . . . . . . . . . . Drop some feedback in the comments below! (e.g., What did you find most useful? How can we improve?)
🙏 Your support is appreciated!
Now, it's your turn!
Be sure to leave a comment; let us know how you see this opportunity and forecast.
Have a successful week,
ForecastCity Support Team

GOLD - Price can exit of triangle and then drop to support levelHi guys, this is my overview for XAUUSD, feel free to check it and write your feedback in comments👊
A few moments ago, the price entered a wedge, bounced from the support line, and rose to the resistance area.
Also, price breaking $2845 level and then it turned around and made correction from resistance area to support line.
Then Gold rose to resistance area again, where it some time traded and then dropped to support level.
Thereby price broke $2935 level and exited from a wedge, after which it started to trades inside a triangle.
In this pattern, price made a gap and then rose to resistance line of the triangle, after which made correction.
Now, I think that Gold can exit from a triangle and then start to decline to $2860
If this post is useful to you, you can support me with like/boost and advice in comments❤️
CADJPY - Take Advantage of This Clean Correction!CADJPY Daily Timeframe
CADJPY has shown a clear impulse in July 2024. We are now in a massive correction, consisting of 3 major waves, ABC. It appears we have almost completed Wave B and now we are anticipating wave C.
We expect wave C to push up to the corrective highs where we have the 61.8 fib.
Here are some key things to watch:
- Wave Structure: Ensure that Wave B has completed its corrective pattern
- Wave C Confirmation: Look for a strong bullish impulse off the lows of Wave B.
- Volume & Momentum: A rise in volume and bullish divergence in RSI/MACD could confirm Wave C is underway.
Confirmation for Wave C:
Break of Structure (BOS) / Trendline Break
When identifying confirmation for Wave C, a Break of Structure (BOS) or a Trendline Break is one of the strongest signals that the corrective phase is ending.
Break of Structure (BOS) – Key Levels to Watch
Wave B typically forms lower highs and lower lows. A break above the last lower high signals a bullish shift.
Look for a decisive close above the previous swing high on the 4H or daily timeframe. A weak break (with wicks) may indicate hesitation.
A higher low after the break adds extra confirmation.
Trendline Break – Reversal Signal
If Wave B formed a descending trendline, watch for a clean breakout with strong bullish candles (not just wicks).
Retest of the trendline as support after the breakout strengthens the case for Wave C starting.
Trade Idea:
- Watch for Wave C to start using the techniques listed above
- Once entered, keep stops below wave B
- Targets: 107 (500pips), 112 (1000pips)
Goodluck and as always trade safe!
See below for our previous swing setups:
Swing Setup 1
Swing Setup 2
Swing Setup 3

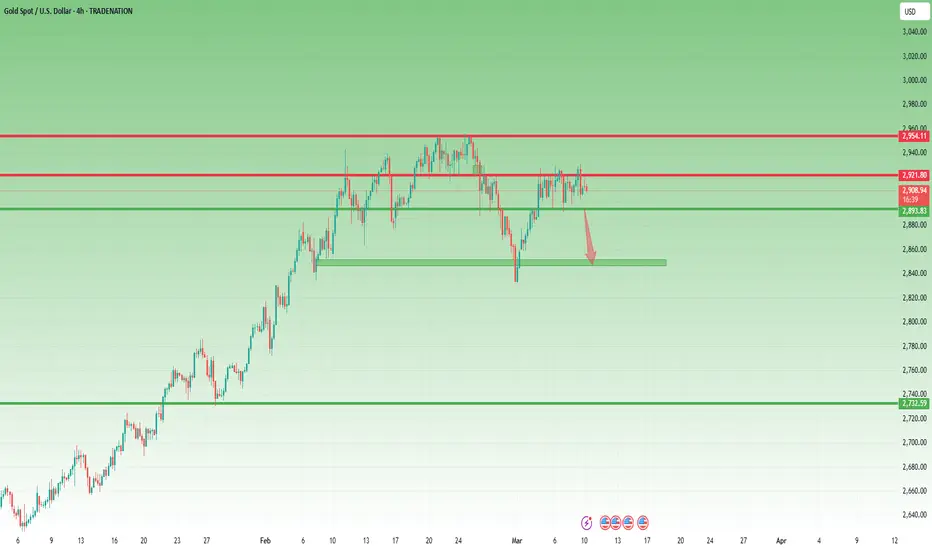
Gold Outlook Unchanged: Waiting for a Break Below SupportFriday's NFP turned out to be a non-event, with gold prices remaining stuck in their familiar range between 2,895 and 2,930.
Following the announcement, prices initially spiked to resistance but quickly retreated to the middle of the range by the weekly close.
Looking ahead, my outlook remains unchanged—I expect a break below the 2,895 support level. If this happens, we could see accelerated downside momentum, potentially testing recent lows in the 2,830–2,840 zone.
My strategy also remains the same: selling rallies against the range’s resistance.
Disclosure: I am part of Trade Nation's Influencer program and receive a monthly fee for using their TradingView charts in my analyses and educational articles.
GOLD (XAUUSD): Important Supports & Resistances For Next Week
Here is my latest structure analysis and important
supports and resistances on Gold.
Resistance 1: 2916 - 2932 area
Resistance 2: 2952 - 2956 area
Resistance 3: 2998 - 3002 area
Support 1: 2832 - 2855 area
Support 2: 2772 - 2786 area
Support 3: 2714 - 2740 area
Consider these structures for pullback/breakout trading.
❤️Please, support my work with like, thank you!❤️
I am part of Trade Nation's Influencer program and receive a monthly fee for using their TradingView charts in my analysis.

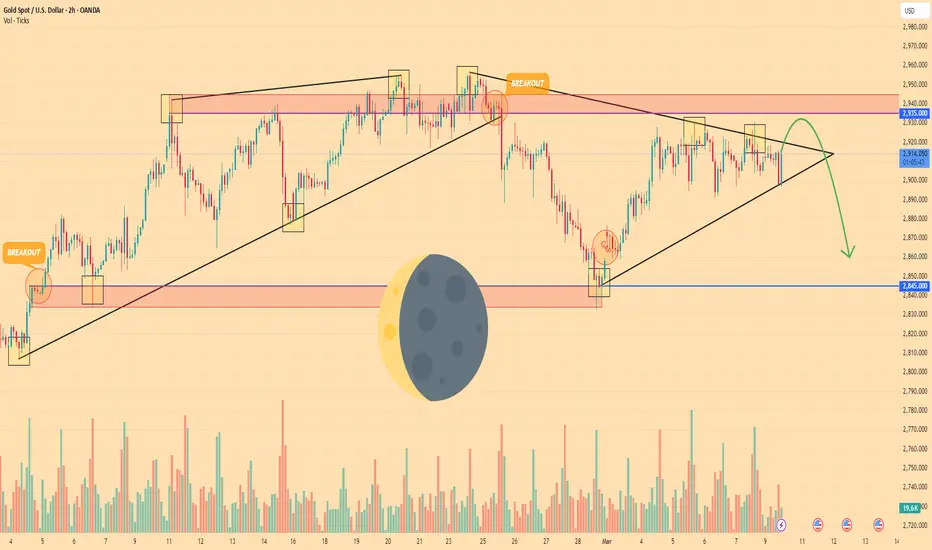
Gold operation suggestions at openingThere is a high probability that the range will break on Monday and Tuesday next week. Before the break, it is considered as a shock. All the bullish and bearish analyses on the market are speculations and have no meaning. The most stable approach is to buy low and sell high around the 2930-2890 range. If it breaks, follow up: if it breaks up, it will continue to rise, with pressure at the high point of 2945-2956; if it breaks down, it will continue to be bearish; support is at 2870-2860
We did not blindly enter long orders on Friday just because the data were all bullish, but chose to wait for the market to stabilize after the data. It was clearly emphasized in the report that such data and market trends are likely to rise and fall or bottom out and rise again, and the facts have proved it again. Since we tend to be bullish, we bought at 2908, reduced our positions at 2924 and took profits, hoping that the pressure of 2930 would break, but at 11 o'clock, there was no hope of breaking, so we took profits and left at 2929 before the break.

XAUUSD and USDJPY Top-down analysisHello traders, this is a complete multiple timeframe analysis of this pair. We see could find significant trading opportunities as per analysis upon price action confirmation we may take this trade. Smash the like button if you find value in this analysis and drop a comment if you have any questions or let me know which pair to cover in my next analysis.

XAUUSDHello Traders! 👋
What are your thoughts on GOLD?
Gold remains below the key resistance zone, experiencing choppy and range-bound movements since last week. As long as the price stays below this resistance level, we expect a potential decline towards the identified support levels.
A break below $2895 could increase selling pressure and open the door for lower targets.
What’s your outlook on gold? Do you think resistance will break?
Don’t forget to like and share your thoughts in the comments! ❤️

Analysis of gold market trend next Monday:
Gold technical analysis: This week, we have been emphasizing that gold is a volatile market. Facts have proved that our team's view is also very correct. We shorted under the pressure of 2930 and bought on dips at 2892. The gold price has fluctuated many times in this range. The price of gold has fluctuated within this range many times. Our team has also been short at high levels and long at low levels in this range, making profits continuously. As long as traders follow our team's ideas, they can easily make a lot of profits this week. Before the market moves out, the fluctuation will continue. Gold's non-agricultural and unemployment benefits on Friday are both bullish for gold, but gold still fell back after rising, and gold is still fluctuating. Gold was shorted at 2928-2930 after the US non-agricultural on Friday. It won two consecutive victories on Friday, but gold is still fluctuating. How long will it fluctuate?
From a technical perspective, gold closed positive this week and may rise or fall next week. If the yang continues to close next week, it is still expected to reach a new high in the later period. Single yin without consecutive yin can only be regarded as a callback rather than a reversal. If it closes negative, the weekly line will switch between positive and negative. The weekly resistance is near this week's high of 2930. If it breaks above, there is a high probability that it will reach the previous high near 2956 or even reach a new high. If 2930 cannot break above, the bottom will first look at the vicinity of 2885. Once it breaks down effectively, it will also go to the vicinity of 2870-2860. If the market wants to see a big pullback, it must effectively break through 2858, otherwise it will fluctuate at a high level and wash the market. Looking at the daily line closing the cross star for three consecutive days, the trend on Monday is unclear. Before breaking through yesterday's high and low points, it is recommended to go short at high levels and long at low levels.
Gold has fluctuated within the box shock range for 1 hour, but the gold 1-hour moving average has begun to turn. If it begins to diverge downward next week, the confidence of gold bulls may be suppressed. Gold is still oscillating in the box, but it should be noted that the resistance range is 2928-2930. Only by effectively breaking through 2930 can the upside be further opened. Therefore, our professional and senior gold analyst team recommends that before breaking through and standing on 2930, do not rush to chase gold at a high level. Either wait patiently for a deep correction to stabilize and be bullish, or wait for the strong attack to stabilize above 2930, and then confirm the stable bullish trend after the retracement. As for standing on 2930, the upper targets are 2945, 2956, and a new historical high.
On the whole, in terms of short-term gold operation ideas next Monday, our professional and senior gold analyst team recommends to focus on callbacks to do longs, supplemented by rebounds to go shorts. The top short-term focus will be on the 2928-2930 first-line resistance, and the bottom short-term focus will be on the 2890-2894 first-line support.

NZDJPY - 2025 Plan. Make It Your Best Year Yet!Here we have the 2 Day chart for NZDJPY.
We've seen a massive impulse mid 2024. We are now in an ABC correction.
We are currently in wave B of the correction, subwave B. Expecting subwave C to complete wave B.
We're looking for a rejection of the fib zone and a drop of over 700pips.
Trade idea:
- Watch for rejection of fib zone
- Once rejection appears, enter with stops above the highs
- Targets: 86 (350pips), 83 (700pips)
Once we've completed this move down, we'll be looking for longs. We'll update this setup if there's enough engagement.
Goodluck and as always, trade safe!

GOLD MARKET ANALYSIS AND COMMENTARY - [March 10 - March 14]OANDA:XAUUSD have recovered strongly this week, rising from $2,858/oz to $2,930/oz before adjusting to $2,910/oz. The main reason is political tension when US President Donald Trump stopped military aid to Ukraine and threatened to sanction Russia if it did not negotiate a ceasefire. This increased instability, supporting gold prices. However, if Russia and Ukraine move towards peace negotiations, gold prices may face downward pressure in the short term, although the possibility is still low.
Furthermore, Mr. Trump’s move forced the European Union (EU) to launch a spending package of nearly 1 trillion euros to strengthen the defense of EU member states. This means that the EU’s budget deficit will become larger, leading to higher inflation and lower growth, thereby increasing the role of gold as a safe haven.
The US non-farm payrolls (NFP) figure for February came in at 151,000, slightly below the forecast of 159,000. The unemployment rate edged up slightly to 4.1% from 4% in January, but the labor market remains untroubled. As a result, the Fed may maintain its current interest rate. Fed Chairman Jerome Powell also stressed that the central bank is in no hurry to cut interest rates as the labor market remains strong and inflation risks remain high.
Rising inflation while the Fed maintains stable interest rates has caused real interest rates to fall, supporting gold prices. In addition, economic instability due to US tariff policies and the complicated developments of the Russia-Ukraine war have also increased the demand for safe haven gold. However, since most of the risks have been reflected in prices, gold may not increase sharply next week and there is a risk of correction due to short-term profit-taking pressure.
🕹SOME DATA THAT MAY AFFECT GOLD PRICES NEXT WEEK:
Inflation will be in focus next week as markets digest a number of key data on US prices and consumer spending. The most notable is the February CPI report on Wednesday, followed by the PPI on Thursday, and the University of Michigan consumer sentiment survey on Friday. Other key events include the US JOLTS jobs report on Tuesday, the Bank of Canada interest rate decision on Wednesday morning, and the US weekly jobless claims report on Thursday.
📌Technically, gold prices will fluctuate in a relatively narrow daily range next week with support at $2,890/oz and resistance at $2,930/oz. If gold prices rise above $2,930/oz next week, they could rise to $2,950/oz, followed by strong resistance at $3,000/oz. However, if gold prices are pushed below $2,890/oz next week, they could fall to the $2,835-$2,860/oz range.
Notable technical levels are listed below.
Support: 2,900 – 2,880 – 2,868USD
Resistance: 2,929 – 2,942 – 2,956USD
SELL XAUUSD PRICE 2976 - 2974⚡️
↠↠ Stoploss 2980
BUY XAUUSD PRICE 2809 - 2811⚡️
↠↠ Stoploss 2805

XAUUSD Possible sell on break of structureXAUUSD with the market opening price has initially bounced from the daily support with strong rejection from the top showing potential drop to the support level. Upon break of structure, expecting a potential sell opportunity to the support level as the price is still showing bearish pressure.

AUDJPY - Growing SHORTS! Big Move Ahead!In one of our last AUDJPY analysis, we indicated that price looked foppish. Since then, we've had almost a 2000pip drop!
That big drop can be marked as wave 1 in our new bearish impulsive trend.
We are now in Wave 2, which is an ABC correction. We have completed Wave A (3 waves). We are now in Wave B (3 waves). We're currently in subwave b of wave B. Expecting subwave c to appear very soon.
Trade Idea:
- Watch for bearish price action on lower timeframe
- You can use trendline break, fibs or BOS to find the reversal point
- When entered, put stops above subwave B.
- Target: 91 (750pips)
4Week Chart
Goodluck and as always, trade safe!
See our previous setups below:

Big drop coming for Gold ?There will be a possible drop to the 2870 level first where it will consolidate for a while before starting the big drop to 2600 area.

Gold 1H Intra-Day Chart 09.03.2025Option 1: Gold pushes higher from CMP, towards a new ATH of $2,960.
Option 2: Gold drops lower towards $2,880 for liquidity before it bounces back up again to the upside.
Which option do you agree with more?

XAUUSD(Gold) Weekly Forecast(READ CAPTION)Hi traders Check Out the Weekly Analysis about Gold And share your ideas About it.
Gold will Drop From Current Area Technical Analysis Indicates Strong Support at 2892 and 2863 And Resistance Zone pointed at 2930.6 Gold Will Drop until 2832 Focus On The Target .
Likes Comments And Share your feedback about it.
