
SYS-LONGOn the daily chart, bullish divergence has been identified, implying the continuation of the current upward trend. Good fundamental stock also give a good profit in short time.

GTYR Technical Analysis: Potential Buy OpportunityOn the daily chart, GTYR is on a steady upward path within an ascending channel, currently testing the Fib 0.5 level. Buy1 is recommended at CMP(46), and Buy2 is recommended at 40—a level that also serves as channel support. A stop-loss on a closing basis is advised below 34. The first target is 55; if the price moves past the channel resistance after that, further targets of 64 and 78 could be reached. The setup shows strong potential with the trendline intact and the RSI in sync. Happy trading!

Bullish on Monthly TF.
Bearish ABCD Pattern seems to appear
with Potential Targets around 900+
However, 690 - 790 is an Important Zone
that needs to Cross & Sustain for further Upside.
Immediate Support can be the CMP if 615 is
not Broken.
Important Support Zone seems to be in the
range of 575 - 605.
Should not break 560 at least, otherwise more
selling pressure can be observed.

PREMA-SHORTThat stock gave us 90 % profit now it will take correction so sell it here and wait for again BUY opportunity .


FFCafter posting a bottom FFC IS now ACCUMULATING from last 1 week, Long entry is recommended from this point.

Engrohafter posting a bottom engroh is moving upside NOW, Long entry is recommended from this point.


a Very Strong Resistance around 138 - 140.a Very Strong Resistance around 138 - 140.
Those who have already taken entry in BCL should
keep a Stoploss of 117 on Closing basis.
Initial Targets can be around 128 - 130 & then towards 136 - 138.
These levels should be easily attained because of
Hidden Bullish Divergence.
Crossing & Sustaining 140 will lead it towards
150 - 155.
Long Term Targets can be above 200+ but that would
be possible if 182 is Crossed & Sustained with Good Volumes.

SSGC TRADE IDEA. RETEST + FVGSSGC is currently on a loosing streak after rallying up almost 80 percent after the breakout on daily chart at 28.75 The stock is now again coming back to retest the previous high at 28.75
There is a fair value gap also around 28.75. A large amount of liquidity is resting at 28.75 to 29.00. The stock will show a quick bounce from these levels.
But the stock will be very volatile near these level as mentioned above.
put limit orders also watch closely near 28.75 to 29.00
As the big players also might hunt for stop losses just below these levels so be careful and watch carefully but this is a big chance to buy as the stock will rally quickly around 10 to 15 percent after absorbing liquidity at these levels!
LETS SEE WHAT HAPPENS.

NETSOL |Ascending Parallel ChannelThis chart shows an ascending parallel channel formation for NETSOL, indicating a potential bullish reversal. The pattern suggests bullish momentum with key targets set at different levels: the initial target at 156 PKR, secondary target at 167 PKR, and a parallel channel projection target at 190 PKR. A stop loss is defined at 130 PKR, mitigating downside risk if it breaks the channel downward. This setup suggests traders are anticipating upward movement, with increasing potential as targets are met, though the stop loss limits potential losses in case of a downward move.

POWER CEMENT PERFECT SETUP FVG + HIGHER HIGH RETEST AND BREAKOUTPower cement fair value gap plus higher high retest at 9.75. also, there was an accumulation box on the higher time frame. the liquidity was resting in the higher high retest in the fair value gap. the stock absorbed all the liquidity at 9.75 and gave a breakout at 10.30, rallying quickly 8 percent in 2-3 hours. that’s how the smart money and the big institutes play!!

Currently at ResistanceCurrently at Immediate Resistance.
Should not break 175.
208 - 210 can be witness if 198 - 199 is
Crossed & Sustained.
Bull run will resume once 228 - 230 is Crossed
with Good volumes.

Different Patterns on Different Time FramesCup & Handle Pattern formation on Monthly TF.
H&S pattern on Daily TF.
S1 around 192 - 193
S2 around 183 - 185
Worst Case scanerio Support around 150.
Should not break 130 - 135.
Upside Targets can be around :
Immediate Resistance around 234 -235
Short to Medium Term : 250 - 270
ABCD Pattern Target around 300

Long LUCKBroken out strongly. Now wait for the retest to long if it comes. Entry, Stop and Exit all there. Remember I will buy spot no leverage here. Its a game of waiting for your entry. Manage your risk! #DYOR
Will update once it fills my order.

SLGL (Ammar)Buy and Sell Levels of SLGL, Pakistani Stock
Secure Logistics Group (Pvt) Ltd (SLG or the Group) has been rendering a broad array of solutions specializing in Logistics and Vehicle Fleet Management Services across the country. The Group has maintained a proven track record in achieving customer satisfaction across its businesses. Our key to success stems from quality human resources, judicious planning and meticulous execution while leveraging country-wide asset base and infrastructure.

PSO at 50% Retracement - Buy OpportunityPSO is currently trading at a 50% retracement level of its ongoing bullish leg. This presents a strong buying opportunity, with the target set at the recent top.

PPL Retracement to Key Fibonacci SupportPPL surged to around 217 before retracing to 171, completing a significant pullback. It is now trading at the 0.618 Fibonacci level, a strong buying zone, indicating potential bullish momentum ahead.

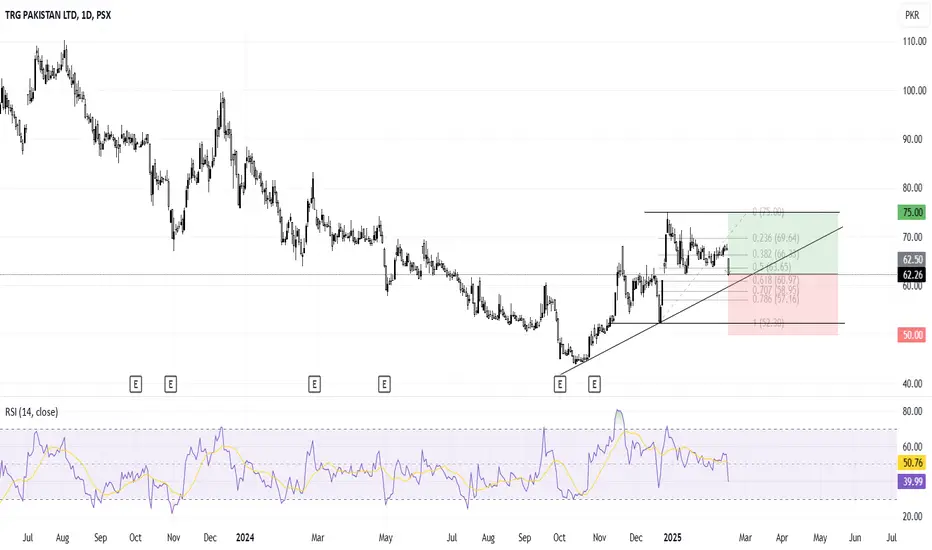
TRG Bullish Reversal: Buy at Golden PocketTRG is trending after a prolonged bearish phase, forming higher highs and higher lows. It is currently trading around the Fibonacci golden pocket. A buy entry at the current market price is suggested, with a stop loss below the last low and a target at the recent high.
HcarHcar down from 338 and retraced about 40 days. Then it broke the retracement line but could not sustain. This break out became the fakeout.
So it can go further down upto 263 Trendline level because it broke the Ultra high volume lower breakout.

SEARL (PSX)Trend is Bulish
price retrace at fib 0.618%
in the triangle price cosolidate .
Traget price is 130
