BILDCO – UAE Stock Market (ADX) Bullish Reversal in Play BILDCO – Bullish Reversal in Play 🚀
Ticker: BILDCO (ADX)
Timeframe: H1
Setup: Elliott Wave + Demand Zone Strategy
Trading Idea:
1. The corrective Elliot Wave (c) ready to wrap up as price dips into a strong Daily Demand Zone between (0.620 - 0.600), right in line with the Fibonacci extensions 1.382 (0.5810) and 1.618 (0.5429).
- If this level holds, we’re looking at the start of a fresh Wave (3) in a new impulse cycle – and Wave (3) doesn’t play small.
2. Demand Zone Confluence:
- Heavy buy-side interest here; volume profile confirms it. This zone is loaded with potential.
3. Bullish Momentum Ahead?
- Price action in this area will tell the story. Watch for confirmation with strong bullish candles (engulfing, hammer, or similar).
Game Plan
1. Entry:
- Long from 0.620 - 0.600,
2. Stop Loss:
- Below the Demand Zone at 0.5712. Keep it tight, protect your capital.
3. Take Profits:
- TP1: 0.7066 – First supply zone.
- TP2: 0.7540 – Next major resistance.
- TP3: 0.8711 – Targeting Wave (5) extension.
4. Risk-Reward:
- Insane RRR of 1:8.59! Small risk, big potential move.
Why This Setup Rocks
- Demand Zone Holds Weight: Fibonacci + price action + volume = solid entry zone.
- Wave (3) Firepower: It’s typically the biggest, most explosive wave – perfect for riding the trend.
- Volume Backing It: Buyers are already lining up, which is what we want to see at key levels.
---
### Disclaimer
Not financial advice – trade at your own risk. Always use proper risk management and evaluate your own strategy before entering a position.
---
### Follow for More Setups
"Missed opportunities are a trader's biggest regret. Stay sharp, stick to the plan, and make the most of every move!"
Hit Follow for more insights and ideas like this one. Let’s crush the markets together! 🚀💹

#parkin may break the top side of trianglein short time we are now in a triangle
our trail stop now is 4.10 that is already in risk free (compare to our entry at 4.00~40.02
we expect the price goes up
our TP is still at 4.4

Modon price action is warning of a potential bullish moveADX:MODON is set for possible bullish move. Long from the green buy zone or wait for break out above 3.9 AED level, I would place stops below 50 MA or below last swing low.
P.S. Not financial advice, my personal view only

ADPORTS has the potential to change trendADX:ADPORTS getting ready for a leg up and has the potential to change trend. Long to target levels shown on the chart, stop daily close below 5.03 AED.
P.S. Not financial advice, my view only!

ADNOCGAS is looking good and about to breakoutADX:ADNOCGAS is trading about 200 and 50 MA with bullish price action. Long the breakout of 3.23 AED, targets are shown on the chart. Stop daily close below 3.06 AED.
Not financial advice, only my view

SALIK Dubai Financial Market Forecasting SALIK show more likely positive with Low high trend up.
As the ABC correction and Fib analysis hits the A and B trend on Day frame. its give hope for moving forward up trend to hit C.
note: be sure to watch and wait the changes for correction to hit BC so you take entry for LONG to hit the next target C to take profit.

Empower is setting up nicely and is about to break outDFM:EMPOWER price action is promising and is about to breakout, long the break out of 1.76 AED to target levels shown on the chart. Stop loss daily close below 1.63 AED or daily close below 50 MA depending on your risk appetite.
PS: Only my view not financial advice!

Possible Scenario for Parkin on 30 mn frameThere is a chance that the price will follow the speculated blue path till reach 2.63 area and where it may bounce toward the target. It can be considered a good signal for entry with the target is around 2.73.
The scenario fails once the price closes below the (stop loss) red line 2.58.

Update on the previous scenario for Ajman Bank
There might be possibility that Ajman Bank reaches the area near the green line so it can be suitable to take quantity around the green line and sell them if the price reaches 1.81
The scenario fails once the price closes below the (stop loss) red line 1.71

Possible scenario for UppIf the W pattern is correct then there is a good chance to buy upp @0.359 or below and sell the full quantity if the price reaches 0.388 .
The scenario fails once the price closes below the (stop loss) red line 0.327

Americana Americana more likely good to buy and hold it for long period investment.
As you see the FIb shows where the discount price area to buy and shows the high price above 50% of fib as premium price which is good to sell.

Long long longA Clear weekly divergence Type 1
Bullish Movement is coming Soon
Share price / RSI
Also Fundamental Analysis Borouge is doing great Q/Q

ADNOCDIST is getting ready for a bull runADX:ADNOCDIST consolidated above the 50 and 200 MA for the past month creating a diamond continuation pattern and seems to be ready for a bull run soon. Anticipated price action and targets are shown on the chart, stop loss daily close below 3.55 AED.

Agthia UAE : Crossing 8 will drive the price to 9.3 then 9.8Daily chart, the stock ADX:AGTHIA is going bullish, forming an expanding rising trangle.
The stock should cross the resistance line R3 until hitting the line R1 at around 8.0
Crossing 8.0, the target can be 9.3 extendable to 9.8
Technical indicators: MACD is positive, RSI is positive but going near over-bought zone (Be careful with a near minor correction).
Consider the stop loss below the line SL

Fertiglobe will probably reverses up hello deas investors
Fertiglobe will probably reverses up if 2.65 is broken up then 3$ and at last 3.4$
so keep eyes on blue levels and fibonacchi levels in order to guide yourself on taking decision of buying.
thank you

Burjeel Abu Dhabi : Watch for a new buy entryWeekly chart, the stock ADX:BURJEEL is on a downtrend since Nov. 2023.
Yet no solid signal of a rebounce.
However, it should start as soon as the price reaches the support level of 2.11.
It can even be earlier at 2.17 as the technical indicator RSI is near "buy" zone.
A close for 2 weeks below 2.11 should be a stop loss signal.
So, the new Buy should be after a clear rebound from the support, then the targets will be 2.4, 2.6 and 2.8 extended to 3.10

Long for union coop for next 2 months Enter price is 2.37
Tp for first step is 2.60
Sl is 2.24
I see good perspective for this asset.

PRICE TO TOP AT 2.45/2.48 LEVEL FOR NEXT CORRECTIONThe price action is setting up for the next leg down.
Previous tops occurred on harmonic time counts of 448 and 651 days
A time expansion of 1008 days is the next time marker to expect a change in trend
The time mark of 1008 days might not necessarily be a high, it will rather be a stronger time for an advance back if a low is made
Trade safe, goodluck

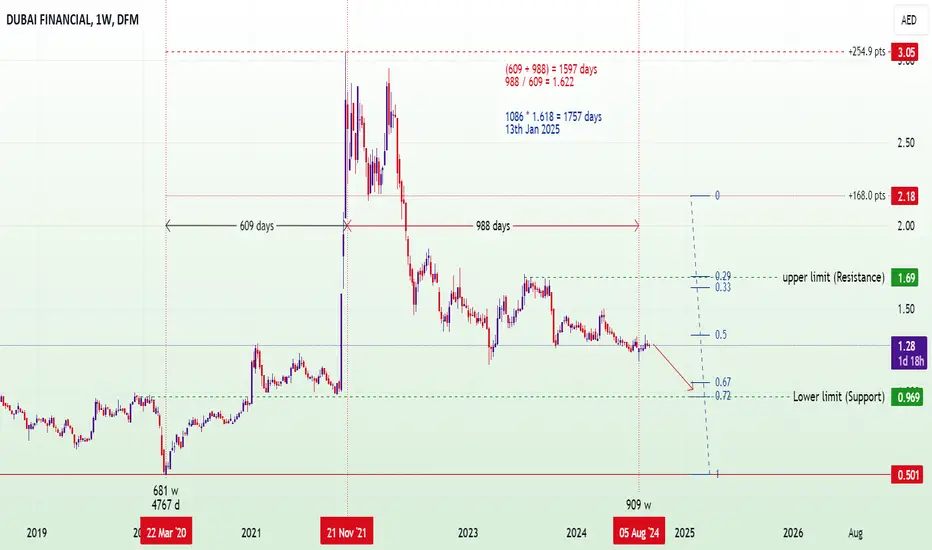
TRADING WITH TIME AND PRICEWe have a primary bear trend that ended the low at 0.501 in 681 weeks
Total points moved = ( 6.91 - 0.501) = 6.409 x 100 = 640.9 pts
Time = 681 weeks
Price = 640.9 pts
The trend from the 0.501 low is our focus where we see a projection of 252 weeks from 22/03/2020 forming a double bottom for a new bull cycle.
On the daily timeframe we have the primary low on 22/03/2020
The first high occurred at 609 days and the correction has since formed two lows at 1086 and 1587 days. From the 609 days point 1597 is a Phi expansion of time. The 1086 time will also form a Phi expansion at 1758 days which coincides with the projected 252 weeks from the primary low. This low will be the take off point for the next bull cycle.
Two conclusions from our projections are
1. Price will decline further to complete the low on the 1.06/0.969 level to complete the first lower degree wave 1
2. Price will advance higher from the low point in a wave 3 fashion advance, all long term entries should be adjusted for a buy and hold for at least 133 weeks from January 2025
Trade safe, good luck
LongIt's now clear
Say goodbye to these prices
At 6.2% yield and growing Q/Q revenu, it's seems it gonna follow the other adnoc sisters and brothers
Crossing Avarage 20,100 and 200 soon

Adnoc Drilling is near a tough resistance zoneWeekly chart, the stock ADX:ADNOCDRILL has been trading in a rising channel since March 2022.
The current price is near the upper channel's boundary (resistance line R).
So, either a breakout around 4.85 - 4.90, or a rebound.
Closing below 4.40 for 2 weeks, will push the price downwards.
Above the resistance line for 2 weeks, the target will be 6.05 - 6.10

NMDC Energy (formerly NPCC) Secures $254.6m Contract from ADNOC Abu Dhabi, UAE: 15 July 2024 – NMDC Energy (formerly NPCC), a subsidiary of NMDC Group, has been awarded a $254.6 million contract by ADNOC Gas for the next phase of the Sales Gas Pipeline Network Enhancement Program (Estidama).
The project, will involve the engineering, procurement, and construction (EPC) of a new pipeline and associated facilities.
This awarded project is part of ADNOC Gas' broader Estidama program, which aims to upgrade and expand its natural gas pipeline network to more than 3,500 km, increasing gas delivery volumes to the northern UAE. The Estidama program includes several packages designed to increase the capacity and efficiency of ADNOC's gas distribution network.
Ahmed Al Dhaheri, NMDC Energy CEO, said, “We look forward to continuing our long-standing partnership with ADNOC Gas through this project. It highlights our shared commitment to advancing the UAE’s energy infrastructure, ensuring a reliable and sustainable supply of natural gas across the emirates, and supporting the nation’s goals of achieving gas self-sufficiency. In addition, this project will not only strengthen the UAE's energy framework but also underscores our commitment to sustainable growth and the local economy, with a significant portion of the contract's value being reinvested within the UAE.”
Last year, NMDC Energy (formerly NPCC), in a consortium with C.A.T. International Ltd., secured a contract on the earlier phase of the Estidama project. Valued at over $600 million, that contract includes the installation of 191 km of new sales gas pipelines, along with additional infrastructure such as nitrogen and water pipelines and a jump-over connection. This contract reinforces NMDC Energy's position as a leading EPC contractor in the energy sector, committed to delivering high-quality projects that drive the UAE's energy industry forward.

NMDC Energy is now part of NMDC GroupFollowing our foundation in 1973, NMDC Energy established a large fabrication yard in Saadiyaat and a skilled offshore construction division. We went on to launch our offshore operations in 1978. Over time, we would regularly expand our service offering to ensure we could continually address the challenges faced by the energy sector.
NMDC Energy is now part of NMDC Group, a collection of forward thinking companies dedicated to shaping the future and generating value for the sectors we operate in. We work in the UAE and across the globe, solving complex problems for leading businesses with cutting-edge EPC solutions.
