Morning Star Pattern??It still looks bullish as its above 200ema and have taken a small bounce. Can this be called a morning star pattern which is bullish!!
Yes!! if we see and positive opening tomorrow and a green closing we can call it a nice morning star pattern and we can take a swing position. Still Bullish!!
Hit like & follow guys ;)

Still in nice UptrendIts still holding the levels amid sell off we can see it have taking a bounce from support level good for intraday. A quick entry and exit recommended.
Hit like & follow guys ;)
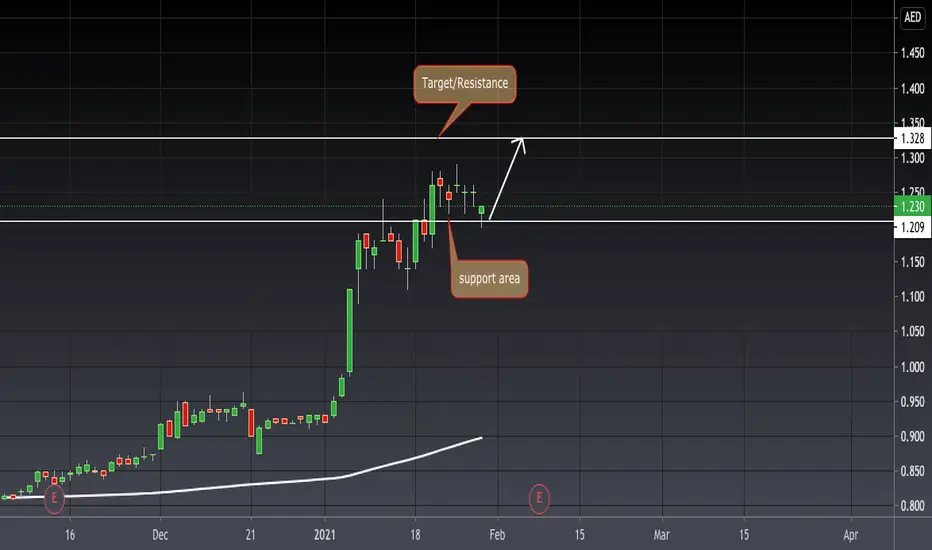
GFH long targetwee need to wait the signal either we reach the support line or we break the resistance line the target long deserve to wait.

DIB has two ways!DIB actually can break the roof of the channel and then it would go towards the next channel roof.
But it can goes down because it has a resistance in front of its route. So be careful and wait to determine more accurate.

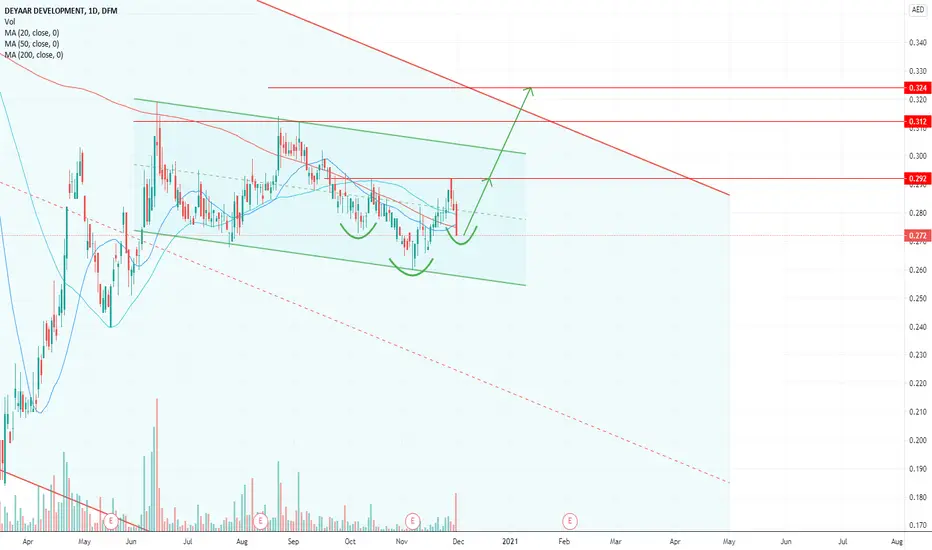
Deyaar Development price predictionDFM:DEYAAR Potential head and shoulders formation, long the break out at 0.292 to target 0.314 and 0.324. A good stock to hold IMO for medium term.
Hit the like button please if you find this useful :)
This is only my own view and not a financial advice, do your own analysis before buying or selling
Happy Trading!
Good ConfirmationA nice pin bar right at the support indicating buyers are activated in that area and pushing the price upside also today with a solid green candle we can have a confirmation that new or fresh buying have started after the profit booking. Over all very bullish!!!
Hit like & follow guys ;)

Nice Bullish MomentumIf you have not purchased GFH today you have missed the train. Very good stock in a bullish mode a nice bullish momentum have again started and now its ready to fly again. After the strong upside momentum we saw a correction and it have retraced exactly at the important FIB levels and it have taken a bounce from the support area. A fresh buying is seen today. Bullish!!
Hit like & follow guys

In a PatternUPP is trading in a pattern as of now there are good chances it can break to the upside. If it breaks to the upside we can have a very good target at around 0.330 to 0.340 area we have to wait and watch the breakout. If you have already entered the trade hold on to it if you are still about to buy thn hold till you see a breakout of this pattern.
Hit like & follow guys ;)

Bullish Candlestick PatternA nice bullish candlestick pattern is seen today that to right at the resistance levels it means buyers are still active and do not want the price to go far from the resistance level there are good chances it can give a breakout of the resistance level as indicated on the chart. A closing above 0.30 will attract more buyers.
Hit like & follow guys ;)

Buy & HoldI have been recommending DFM since so long even before the breakout. Its very bullish with strong fundamentals!! next target is good buy and hold it till you see good profits. Bullish mode!!
Hit like & follow guys ;)

GFH wait for the signaleither you wait for the breakout trend line or enter after the price hits the support area and back to retest the swing high

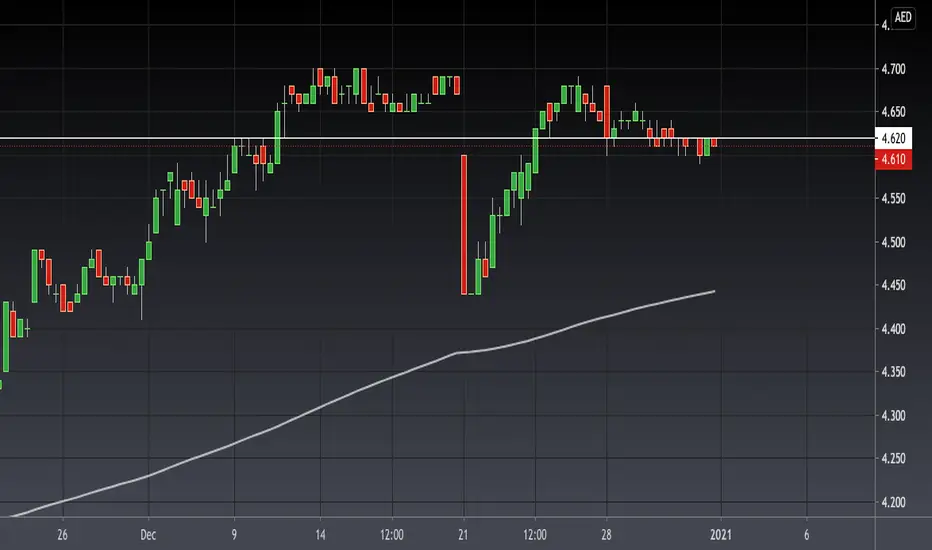
Nice MoveEmaar made a nice bullish run and it crossed a strong and psychologial resistance of 4.00 and now its holding it at the same levels to make another big move. Next resistance is around 4.13 it order to continue the bullish momentum emaar should hold at 4.00 levels over all bullish !!
Hit like & follow guys !!

Hold ItUpp after consolidating for so many days it finally made a breakout and its now in a retest mode and its holding around 0.298 to 0.30 levels which is support for now. Its still bullish and big move is expected to cross the near term resistance of 0.305 area. Keep a stop loss around 0.292 and target at 0.340 to complete the swing.
Hit like & Follow guys

Builish ModeDeyaar is still bullish mode after the breakout it made a big move and touched 0.310 and returned back. But still the momentum is bullish and more upside is expected i am still holding my trade and will sell at 0.320
Hit like & follow guys !!


Bullish - Long Term - Dubai investment (DIC)For investor in Dubai Stock Market , one of my best Chart is ( DIC) , Double Bottom Pattern Complete , the target is much higher as my forecast ( 1st target around 2.25 ) next above 3.75 AED

expecting DIC to fall back to 79 area expecting one more drop on DIC to fall back to 79 , gona keep how it will act around the line of it will reverse or will consolidate and continue up

Emaar Properties is showing bullish price actionDFM:EMAAR broke out supported by a bullish cross over between the 200 SMA and 50 SMA. Any pullback towards 3.26 or if the pullback extends toward 3.06 is considered a buying opportunity.
Short term targets with anticipated price action are shown on the chart.
Hit the like button please if you find this useful :)
This is only my own view and not a financial advice, do your own analysis before buying or selling
Happy Trading!

Is DFM hiding something up its sleeve?Dubai has established itself as a major financial hub and even though its tourism and aviation industry has slowed down right now, it is a great place to live in and I think there is tons of potential for it to grow on financial services or technology over the next 10 years.
The coronavirus crisis has been managed effectively by the UAE government, much better than in many European countries.
DFM has been in a downtrend since 2014, in a huge descending triangle, having tested 4 times in 10 years its support to ultimately consolidate for the past 18 months above it's 50 week moving average.
After the coronavirus shock, in Dubai, the fear is everywhere and the sentiment is very low. Layoffs are everywhere, rents have fallen by 20%-30% in the past year, people are selling properties as fast as they can and everyone just wants the pain to stop.
All of these signs usually coincide with market bottoms.
The UAE government is taking steps to provide more of a permanent residency for a variety of people, the latest ones being the people who work from home as freelancers or employed by companies abroad, giving them the opportunity to enjoy the Dubai lifestyle and tax-free income.
So far, many of the so called "digital nomads" have chosen different countries such as Thailand, but they might want to switch considering the latest developments. (monarch protests)
In addition, the overspend of Europe, Australia & US on the Covid crisis will put pressure on them to increase some already high taxes over the next decade, pushing even more qualified workforce to a place like Dubai.
Despite the ugly chart above, down sentiment and lack of momentum right now, there are major multi-month divergences on both OBV & MACD pointing to a potential move up.
In addition, in September, property transactions increased and for the first time in a while there are positive price changes and even talk of undersupply in some established communities
I'd wait for the triangle to be broken to the upside and for a weekly close above 0.999 to get in for the long term, cause I believe Dubai has the potential of being the next Hong Kong & Singapore.

Very TrickyAgain same thing for DIB we want to see another candle closing to decide on the trade as of now it have made a small candle and closed below the support line which will not act as a resistance. If we see an green candle closing tomorrow it will be a good buy as of now lets wait and watch over all in a uptrend.
Hit like & follow guys ;)
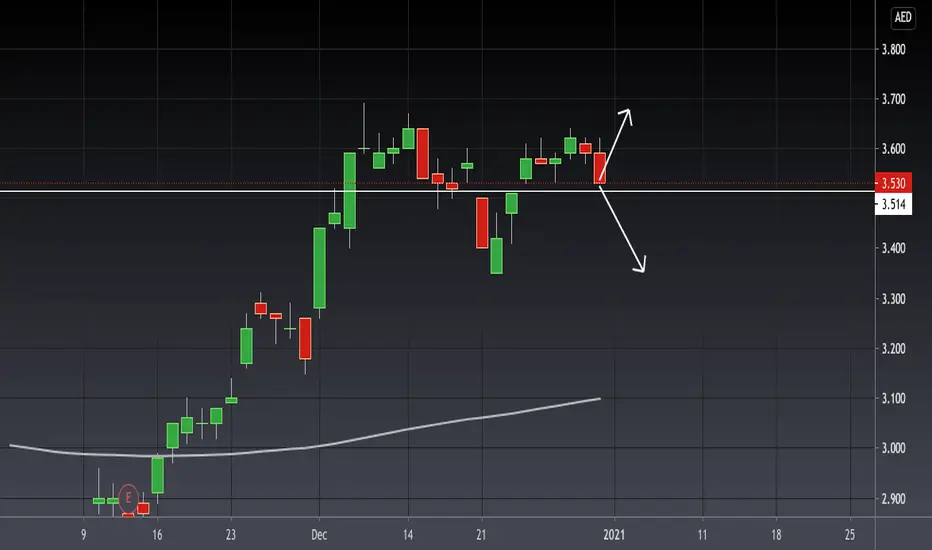
Decide Please!!Emaar is stuck as of now and is not tradeable its strong support is at around 3.51 area now if we want to trade this we want to see it touching the support line and making a bullish candle if not then we go further down. Yes its in a uptrend as of now but very tricky to trade we need one more candle closing to decide and enter the trade.
Hit like & follow guys ;)
Good Buy? or BYEIts a good buy surely as it have taken a bounce from the support level and its holding it can be a good swing trade and next target is also good that is the previous swing high that is around 0.910 very bullish!!
Hit like & follow guys

Under PressureIt have not been performing lately as of now its at a solid technical resistance and also in a near term downtrend. It have to cross this resistance line that is 0.280 and the next resistance is 0.295. If it does not hold and break up side next support is 0.722 levels.
Hit like & follow guys ;)
