OPEN-SOURCE SCRIPT
Stratus [DW]
Updated

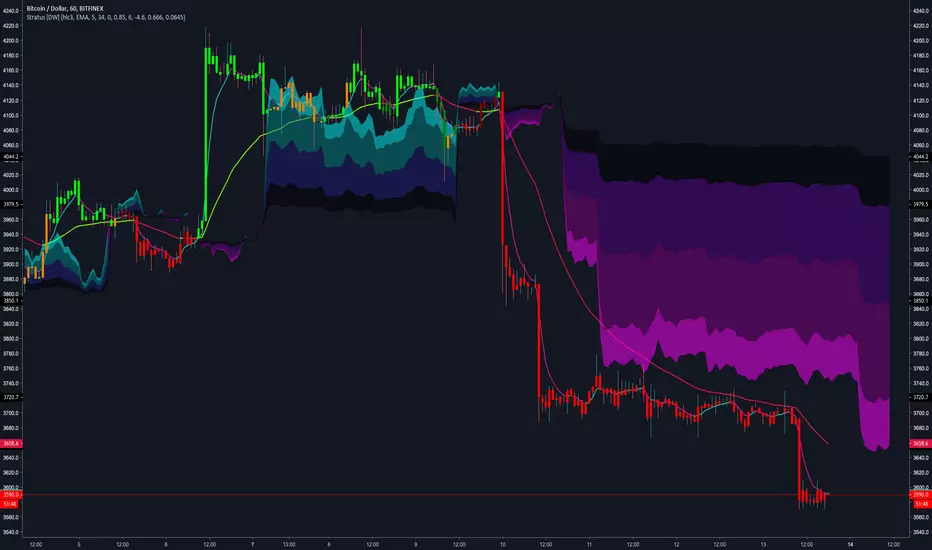
This is an experimental study designed to identify trend activity, and potential support and resistance areas.
First, Coefficient of Variation Weighted Moving Average (COVWMA) is calculated, and its intersection points are used as anchor values.
Next, a fast period COVWMA calculated for a signal line.
For the cloud, its mid level is calculated first by taking the median of the range between price and the last anchor value.
The upper and lower cloud values are calculated by slicing the range in half two more times on each side. The result looks similar to stratus clouds, hence the name.
Finally, the result is offset by half of the specified period.
Custom bar colors are included.
Release Notes
Updates:Added alternate moving average types. The available moving averages now in this script are:
-Exponential Moving Average
-Simple Moving Average
-Smoothed Moving Average
-Weighted Moving Average
-Volume Weighted Moving Average
-Hull Moving Average
-Least Squares Moving Average
-Arnaud Legoux Moving Average
-Coefficient of Variation Weighted Moving Average
-Fractal Adaptive Moving Average
-Kaufman's Adaptive Moving Average
Added a McGinley Dynamic Mode to the script.
Added directional color scheme to the moving averages for additional confirmation of price activity.
Anchor points are now determined by crosses between the fast and slow filter, rather than raw price and the slow filter.
Bar color scheme has been slightly modified.
Please Note: Each moving average type generates different cloud values, so play around with them and find the one that works best for you.
Release Notes
Updates:Filter Types are now selected using an easy to use dropdown menu.
Bar color scheme has been slightly modified for better signaling.
Open-source script
In true TradingView spirit, the author of this script has published it open-source, so traders can understand and verify it. Cheers to the author! You may use it for free, but reuse of this code in publication is governed by House rules. You can favorite it to use it on a chart.
For my full list of premium tools, check the blog:
wallanalytics.com/
Reach out on Telegram:
t.me/DonovanWall
wallanalytics.com/
Reach out on Telegram:
t.me/DonovanWall
Disclaimer
The information and publications are not meant to be, and do not constitute, financial, investment, trading, or other types of advice or recommendations supplied or endorsed by TradingView. Read more in the Terms of Use.