OPEN-SOURCE SCRIPT
4C Daily Levels Suite + Premarket High/Low
Updated
This '4C Daily Levels Suite + Premarket High/Low' indicator is a clean way to automatically plot important daily levels including:
Prior Day High
Prior Day Low
Prior Day Close
50% level between Prior High/Low
Today's Open
Today's Premarket Low+High
This Daily Levels indicator is unique in its ability to:
-Plot all of the daily level PLUS premarket high/low levels (extended hours must be turned ON)
-Can hide past days levels, only plotting levels on the current day, to keep chart cleaner
-Can extend line levels right or fullscreen
-Plots the level price at each level on the chart
-Can show/hide price levels labels
-Can add supplemental premarket levels plot to show levels being formed during the premarket time period
-Coded with line.new vs plot so dashed lines are available as a style
-Automatically hides the indicator if the timeframe selected is Daily or greater
SEE SCREENSHOT EXAMPLES BELOW
Default mode, with extended hours showing:

With supplemental premarket plot showing:

Default mode without extended hours showing:

Showing past day’s levels

Extend lines to fullscreen

Some parts of this code were adapted from 'pd Levels' by CryptoCurl
Prior Day High
Prior Day Low
Prior Day Close
50% level between Prior High/Low
Today's Open
Today's Premarket Low+High
This Daily Levels indicator is unique in its ability to:
-Plot all of the daily level PLUS premarket high/low levels (extended hours must be turned ON)
-Can hide past days levels, only plotting levels on the current day, to keep chart cleaner
-Can extend line levels right or fullscreen
-Plots the level price at each level on the chart
-Can show/hide price levels labels
-Can add supplemental premarket levels plot to show levels being formed during the premarket time period
-Coded with line.new vs plot so dashed lines are available as a style
-Automatically hides the indicator if the timeframe selected is Daily or greater
SEE SCREENSHOT EXAMPLES BELOW
Default mode, with extended hours showing:
With supplemental premarket plot showing:
Default mode without extended hours showing:
Showing past day’s levels
Extend lines to fullscreen
Some parts of this code were adapted from 'pd Levels' by CryptoCurl
Release Notes
Small update - moved each level's label positioning slightly further to the right to improve appearance Release Notes
Update 04/26/22-Added settings input to be able to adjust label positioning. Default value is 10 bars to the right
Release Notes
Update 042822*Fixed bug where the Premarket High and Low labels did not show the correct price. Thanks to Kielbasa for finding the bug
Release Notes
Update 042822
Small code reorganizing.
Also updating the main chart to reflect recent bug fix
Release Notes
Fixed bug where the Premarket High/Low lines would not extend right (with all the other levels) when the option was checked.Release Notes
03/07/23 MAJOR UPDATEMuch more customizability and a cleaner look!
Plots Important Daily Levels
- Prior Day High
- Prior Day Low
- Prior Day Close
- Today's Premarket High + Low (extended hours must be turned ON)
- Today's Open
Features
- Can hide past days levels, only plotting levels on the current day, to keep chart cleaner
- Can extend line levels right or fullscreen
- Turn on/off individual level plots, and individually customize each line
- Plots the level value on the price scale as a label
- Can show/hide price levels labels
- Automatically hides the indicator if the timeframe selected is Daily or greater
New Features
- Levels are now plotted starting at the beginning of the premarket session (00:00), and now end at the end of the same day (20:00 est) instead of at the start of the RTH (09:30 est). Plots used to start at the RTH (09:30 est) opening and end 24 hours later at (0930 est).
- Plots used to start at the RTH (09:30 est) opening and end 24 hours later at (0930 est).
- The values for the levels can now be added as labels WITHIN the price scale. This is not possible using the line.new function, and a workaround has been implemented
- Plots the level value on the price scale as a label
- Turn on/off individual Levels, and individually customize each line
- Cleaned up and organized code
SEE SCREENSHOT EXAMPLES BELOW
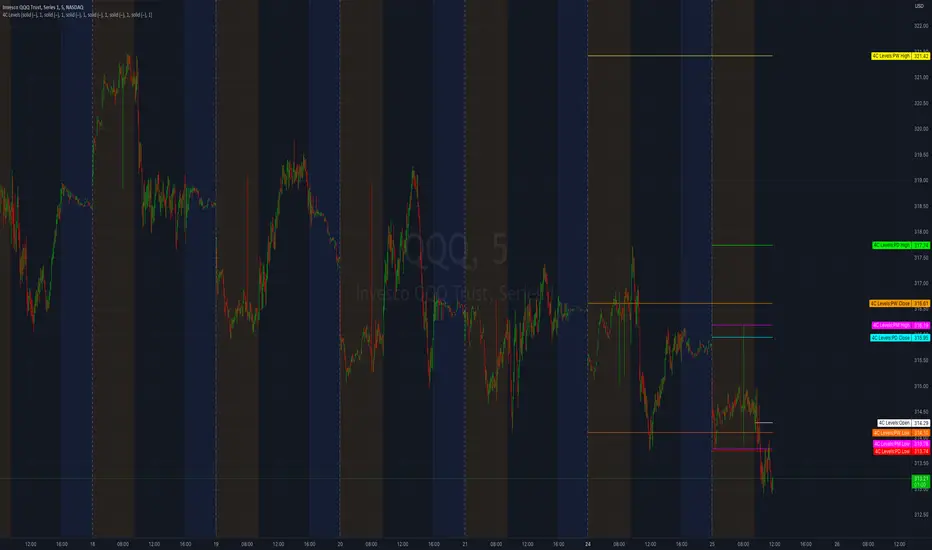
Default mode, with extended hours showing. Showing Current Levels Only. Note the price levels are shown as labels in the Price Scale:
Without extended hours showing only current levels:
Showing all prior daily levels:
Current Levels extended fullscreen:
tradingview.com/x/8kVu7A2V/"
Release Notes
03/08/23 - Fixed Today Open level bugRelease Notes
03/08/23 - Fixed the Today Open level bug (v2). Should be good now. Also changed rearranged some of the code for organization.Release Notes
03/09/23 - Changed indicator settings so the Style tab is not editable for the Label Plots. Deleted input.text regarding dealing with Styles Settings. Release Notes
03/13/23 Fixed Line Style bugs on prior close and today open. Thank you T3chn0joe for spotting itRelease Notes
04/25/23 Added Prior Week High, Low and Close. Can now plot all 3 levels, with the same functionality as the existing levels.Release Notes
Version Update:Fixed Vertical Line Issue: Resolved an issue where levels were incorrectly plotting as vertical lines on the first bar of the trading day. The lines are now correctly plotted horizontally from the start by adjusting the x2 coordinate to bar_index + 1.
Code Optimization: Improved the handling of line extensions and deletions to ensure that only the relevant lines are displayed based on user settings.
Open-source script
In true TradingView spirit, the author of this script has published it open-source, so traders can understand and verify it. Cheers to the author! You may use it for free, but reuse of this code in publication is governed by House rules. You can favorite it to use it on a chart.
Disclaimer
The information and publications are not meant to be, and do not constitute, financial, investment, trading, or other types of advice or recommendations supplied or endorsed by TradingView. Read more in the Terms of Use.