PROTECTED SOURCE SCRIPT
Anchored VWAP w/ Stdev and VWMA Cloud
Updated

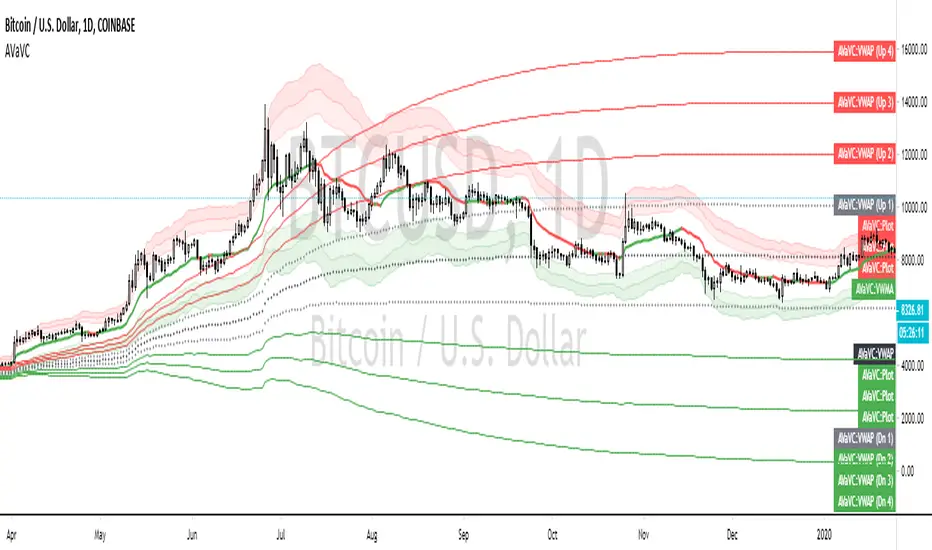
This is a fun little project that allows you to anchor the Volume Weighed Average Price (VWAP) to a specific day and plot up to 4 standard deviations up or down.
I've also added a Volume Weighted Moving Average (VWMA) plot and accompanying cloud to more easily visualize how volume-based momentum affects trends.
Typically, you'll see price respecting the VWMA Cloud and can expect price bounces off of the VWAP standard deviations.
When setting the initial anchor point, it's best to select a day with high volume and volatility.
This idea is not 100% original, but I couldn't find 1) a public script combining the ideas and 2) the correct plotting of the standard deviation via accumulation.
Happy Trading!
FAQ
Why is your script Protected?
Users like to take my open-source code and charge to use it without my permission.
How do I use this to trade?
Add it to your chart and see what stacks up with your current setup. I trade Forex, so what looks bad on my charts might look golden on yours.
How long have you been doing this?
I've been coding for about 8 years and actively trading for 2 years. My degree is in Robotics Engineering and I became obsessed with investing at 22.
How do you trade?
Hurst + SNR + MESA MAMA + ATR + LSTM + Pure Grid. You can't completely code this setup using Pinescript, but if you learn C++ or Python you're there!
Are your returns good?
I average 0.68% every weekday or 22.65% monthly, using the method above.
Can you build my indicator or strategy?
Absolutely! If it hasn't been done before and it improves our community, then consider it done.
But can you build an indicator or strategy for me and only me?
Citing the house rules, I cannot solicit for any purpose. So saying "PM me" would be a grievous violation of said rules, obviously.
Release Notes
The anchored VWAP will only do correct calculations on the daily, therefor I've disabled it's usage on lower timeframes.Intrabar calculations coming soon.
Algo Trading Simplified 👉 PaxProfits.com
Discover the easy way to manage Forex trading accounts. Trusted by traders globally.
Forex Trading Coaching 👉 primetimefox.com
Learn consistent currency pair trading from a professional.
Discover the easy way to manage Forex trading accounts. Trusted by traders globally.
Forex Trading Coaching 👉 primetimefox.com
Learn consistent currency pair trading from a professional.
Disclaimer
The information and publications are not meant to be, and do not constitute, financial, investment, trading, or other types of advice or recommendations supplied or endorsed by TradingView. Read more in the Terms of Use.