OPEN-SOURCE SCRIPT
Month breaks
Updated
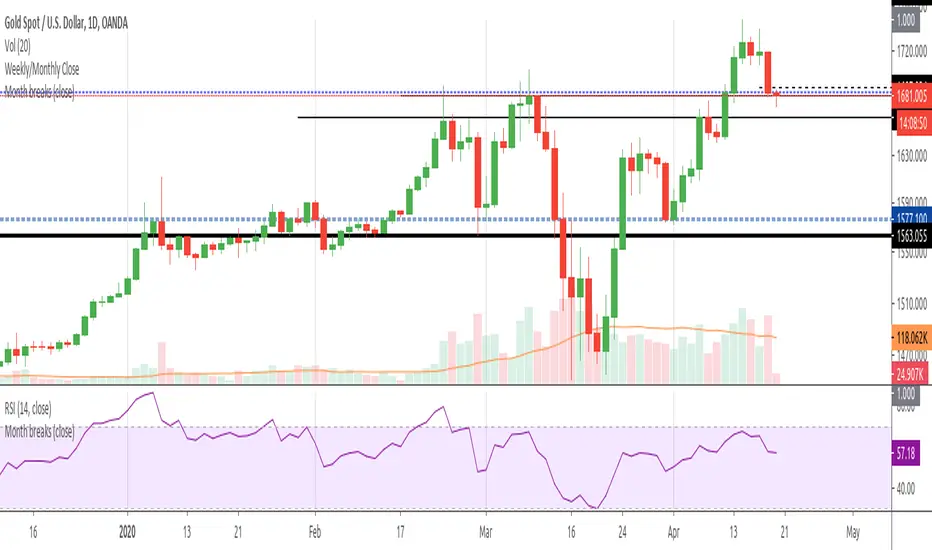
A very simple indicator that marks the start of every month with a vertical line. But default the vertical line is gray with 80% transparency but you can customize the style/color/transparency as you like.
I hate crowded charts, bloated with all kind of crazy shapes and I created this indicator for two main reasons:
1. beginning/end of the month is an excellent pivot-point
2. to be simple, easy to customize and non-intrusive with the underlying chart
See the attached EURUSD daily chart, at the beginning of every month the price pivoted up and down, can you figure out what happens at the end of Dec 2019?

Trade long and prosper!!!
I hate crowded charts, bloated with all kind of crazy shapes and I created this indicator for two main reasons:
1. beginning/end of the month is an excellent pivot-point
2. to be simple, easy to customize and non-intrusive with the underlying chart
See the attached EURUSD daily chart, at the beginning of every month the price pivoted up and down, can you figure out what happens at the end of Dec 2019?
Trade long and prosper!!!
Release Notes
CHANGES- display the indicator on intraday and daily time frames only
- hide indicator value label on price axis
Release Notes
Small change to apply this indicator to another indicator (RSI, MA, etc)Open-source script
In true TradingView spirit, the author of this script has published it open-source, so traders can understand and verify it. Cheers to the author! You may use it for free, but reuse of this code in publication is governed by House rules. You can favorite it to use it on a chart.
Disclaimer
The information and publications are not meant to be, and do not constitute, financial, investment, trading, or other types of advice or recommendations supplied or endorsed by TradingView. Read more in the Terms of Use.