PROTECTED SOURCE SCRIPT
Hull RSI
[Experimental Indicator]
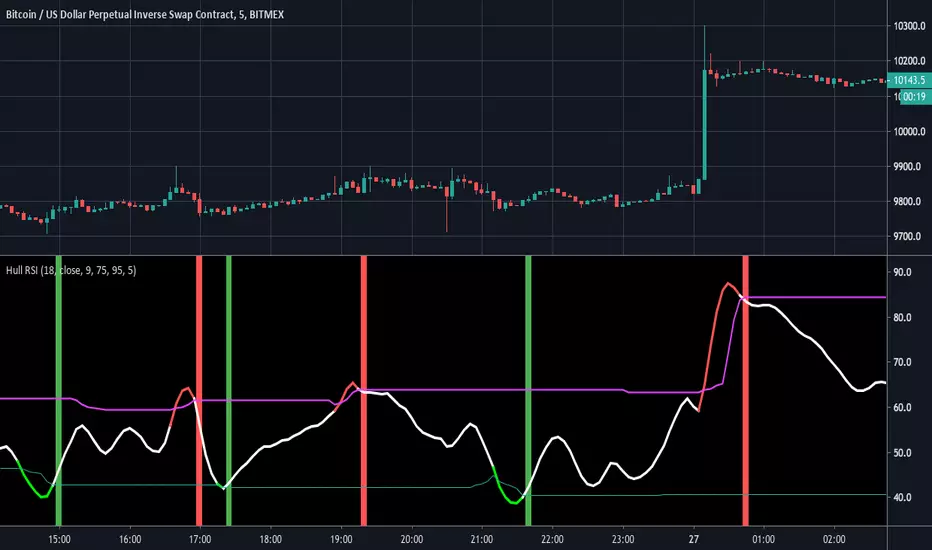
This is an RSI that is smoothed with a faster Hull Moving Average. The upper pink and bottom teal lines represent the 95th and 5th percentiles of Hull RSI values over a window of user-defined length.
The two percentile bands function identically to the traditional upper and lower bounds used in the standard RSI setup. Buy signals are plotted as the vertical green background highlights and sell signals are the red highlights. Buy signal is generated when RSI is below the lower teal line and then crosses above it. Sell signals occur when Hull RSI was previously above the upper pink line and then crosses back under.
-Profit Programmers
profitprogrammer.com
profitprogrammer.com
Disclaimer
The information and publications are not meant to be, and do not constitute, financial, investment, trading, or other types of advice or recommendations supplied or endorsed by TradingView. Read more in the Terms of Use.