OPEN-SOURCE SCRIPT
How To Color Prior Bars
Updated
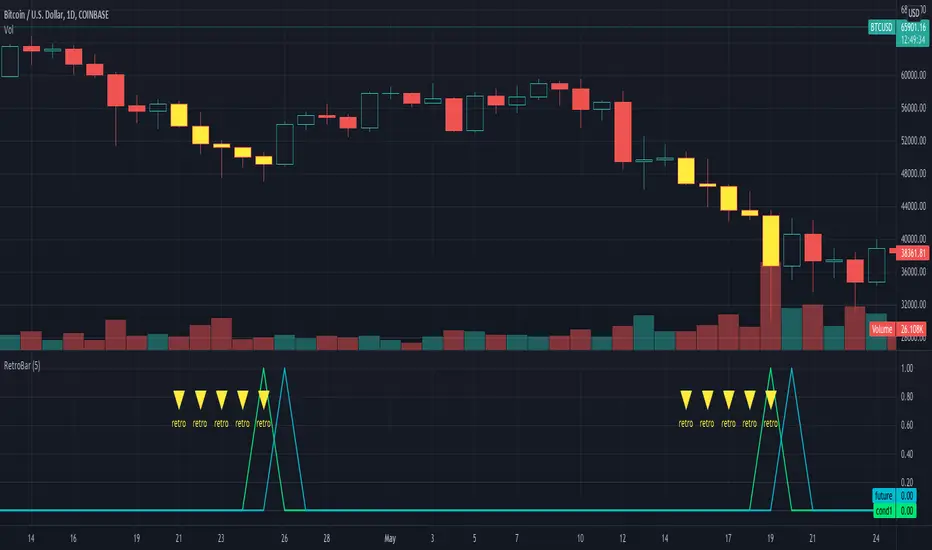
Example how to color the trigger bar of the condition and n-1 prior bars using only 1 barcolor() function.
Currently when offsets are used in barcolor(), bgcolor(), plot(), plotarrow(), plotchar(), or plotshape(), the offset only works with a simple (static) integer. If series (dynamic) integers are used instead, there is not an error, but the series values are ignored. Because of this limitation of offset being constrained to using only fixed offsets, the normal way to paint 3 Black Crows would be to use 3 barcolor() functions. Since there are a known number of bars to be painted in that scenario, this can be easily accomplished.
If a condition encompassed a variable length of n bars, then the number of barcolor() functions needed to use would be unknown. How to color the trigger bar of the condition and n-1 prior bars using only 1 barcolor() function? Dual examples below solves issue but requires n "future" bars, because of this it will not paint the most recent condition in realtime and may not be applicable for use in certain realtime situations. It paints similar in behavior to how a pivot does. Special thanks to LucF and RicardoSantos for illumination!
NOTICE: This is an example script and not meant to be used as an actual strategy. By using this script or any portion thereof, you acknowledge that you have read and understood that this is for research purposes only and I am not responsible for any financial losses you may incur by using this script!
Release Notes
Updated for Pine Script v5.Release Notes
Cosmetic.lux ex tenebris • deuro mea umbra absens • Telegram: t.me/allanster
Open-source script
In true TradingView spirit, the author of this script has published it open-source, so traders can understand and verify it. Cheers to the author! You may use it for free, but reuse of this code in publication is governed by House rules. You can favorite it to use it on a chart.
Disclaimer
The information and publications are not meant to be, and do not constitute, financial, investment, trading, or other types of advice or recommendations supplied or endorsed by TradingView. Read more in the Terms of Use.