PROTECTED SOURCE SCRIPT
WIB & 3WTC V2
Updated
This is an improved version of in.tradingview.com/v/KqHra38X/
User gets to choose how the chart patterns to be plotted.
Instructions:
1. When adding the indicator you will be asked to choose the available options which are,
2. To change the colors for the respective patterns go to indicator's settings page
3. To change the shapes and its color then go to the style tab of the indicator
4. User has an option to choose either of them or both
Bar color

Shapes

Both

User gets to choose how the chart patterns to be plotted.
Instructions:
1. When adding the indicator you will be asked to choose the available options which are,
- Changing the bar color
- Plotting shapes
2. To change the colors for the respective patterns go to indicator's settings page
3. To change the shapes and its color then go to the style tab of the indicator
4. User has an option to choose either of them or both
Bar color
Shapes
Both
Release Notes
- volume contraction check
- adapted input colours to plotting shape
Release Notes
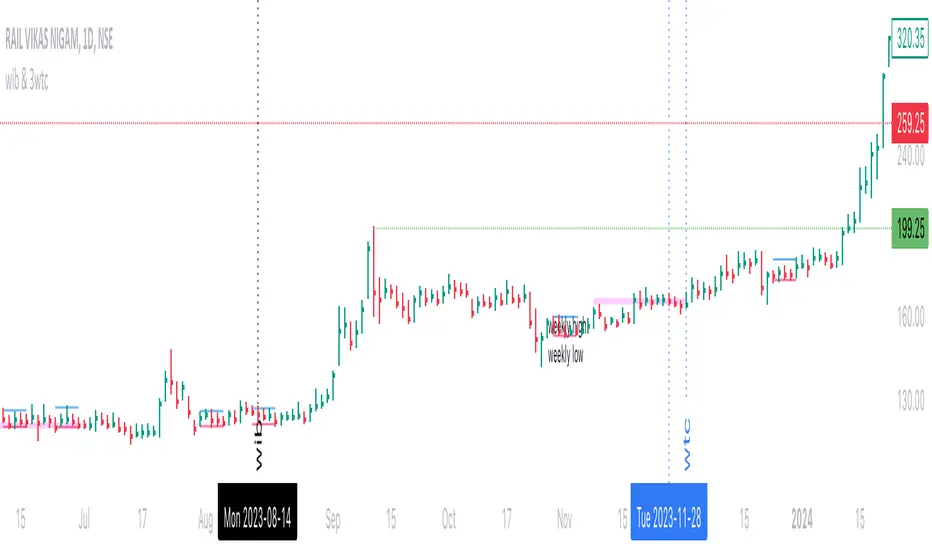
Weekly inside bar and Weekly tight closeUpgrade:
Both Wib and Wtc which had option to plot in the weekly chart is now visible in Daily chart.
- wib in daily chart is plotted with two lines blue (weekly high) and red (weekly low)
- wtc in daily chart is highlighted with the purple colour (Can be modified) which determines last three weeks closing range by default closing percentage level is 1.5 ( Users can modify this value in input )
Disclaimer
The information and publications are not meant to be, and do not constitute, financial, investment, trading, or other types of advice or recommendations supplied or endorsed by TradingView. Read more in the Terms of Use.