INVITE-ONLY SCRIPT
The K2 v2.0 Strategy
The updated version of THE K2 is finally here! A lot of changes were made when creating the second version of the K2, but the result was a much higher level of performance.
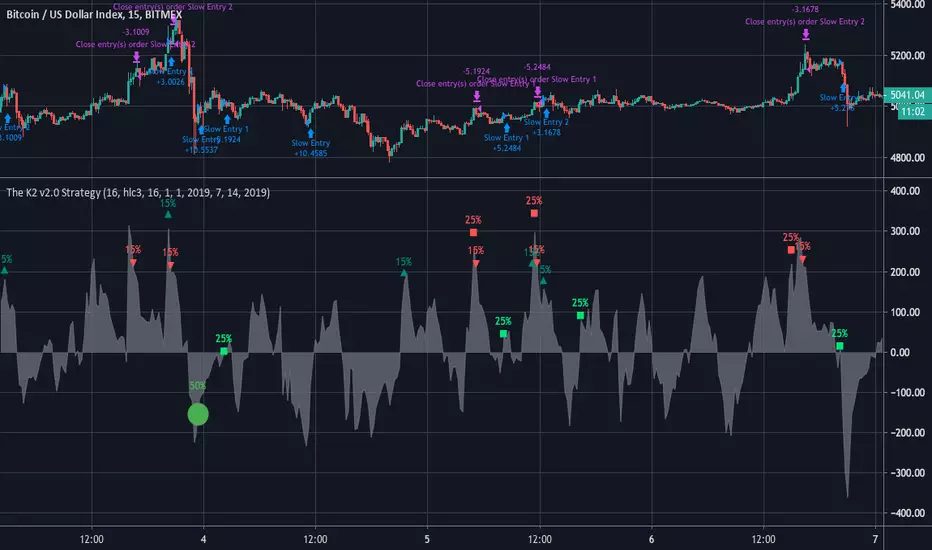
The new K2 consists of a 1 minute 'fast' CCI and 15 minute slow CCI. We identified key thresholds for each one to construct a more complex trading approach. The green shapes on the chart represent buy signals and the red shapes are sell signals. The text above them is the percentage of equity used in each trade. These percentages are based on the CCI's position relative to the fixed thresholds. By doing this, the strategy achieves a higher frequency of trades and lower max drawdown.
Here's a guide to help understand the various shapes:
Circles: Slow CCI trades using 50% equity.
Squares: 25%
Triangles: 15%
Crosses(X's): 10%
We will update the user guide on our website(ProfitProgrammers.com) to include an in-depth guide to using the new K2.
The results displayed on the chart are the results for the month of April. As always, the K2 strategy comes with its study equivalent(at no extra cost).
If you're interested in the K2, message us for a free 3 day trial!
All of our invite only studies and strategies can be found on our website ProfitProgrammers.com
-Profit Programmers
profitprogrammer.com
profitprogrammer.com
Invite-only script
Access to this script is restricted to users authorized by the author and usually requires payment. You can add it to your favorites, but you will only be able to use it after requesting permission and obtaining it from its author. Contact ProfitProgrammers for more information, or follow the author's instructions below.
Please note that this is a private, invite-only script that was not analyzed by script moderators. Its compliance to House Rules is undetermined. TradingView does not suggest paying for a script and using it unless you 100% trust its author and understand how the script works. In many cases, you can find a good open-source alternative for free in our Community Scripts.
Want to use this script on a chart?
Warning: please read before requesting access.
Disclaimer
The information and publications are not meant to be, and do not constitute, financial, investment, trading, or other types of advice or recommendations supplied or endorsed by TradingView. Read more in the Terms of Use.