PROTECTED SOURCE SCRIPT
TheSandyBanana
Updated
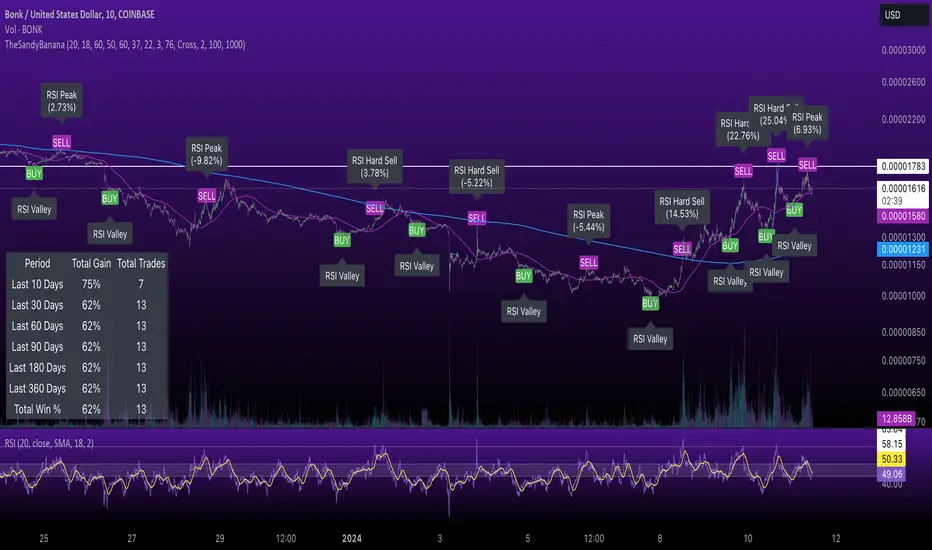
TheSandyBanana is a comprehensive trading indicator designed for various asset classes. It combines multiple technical analysis tools to provide buy and sell signals, aiding traders in making informed decisions. This script is suitable for traders who prefer a combination of trend-following and momentum strategies.
Features:
RSI-Based Signals: Utilizes a modified Relative Strength Index (RSI) with an extended period of 200 bars for smoothing, providing a less reactive but more stable momentum indicator.
RSI EMA: Applies an Exponential Moving Average (EMA) with a 100-bar period to the RSI, further smoothing the RSI and aiding in the identification of longer-term momentum trends.
ATR for Volatility Analysis: Employs the Average True Range (ATR) over a 100-bar period, adjusted with a multiplier of 1. This is used to gauge market volatility and filter signals based on market dynamics.
Peak and Trough Detection: Detects peaks and troughs in the RSI EMA using refined logic and a lookback period of 33 bars, helping in pinpointing potential reversal points.
Dynamic Buy and Sell Signals: Generates buy signals when a trough is identified, and the RSI is below 50, indicating potential upward momentum. Sell signals are generated at peaks when the RSI is above 50, suggesting possible downward momentum.
333-Period EMA: Features a long-term 3333-period EMA, plotted on the chart for trend analysis and potential dynamic support or resistance levels.
Alert Conditions: Includes conditions for buy and sell alerts, making it easier for traders to be notified of potential trading opportunities.
Usage:
This indicator is best suited for traders looking for a blend of trend and momentum analysis. The extended periods used in RSI and EMA calculations make this indicator more suitable for medium to long-term trading strategies. Traders should consider combining this indicator with other forms of analysis (like fundamental analysis or additional technical indicators) for comprehensive trading strategies.
Disclaimer:
Trading involves risk. This script is provided for informational purposes only and should not be considered as financial advice. Traders should always conduct their own due diligence and use the script in a simulated environment before applying it to live trading.
Release Notes
TheSandyBanana is a comprehensive trading indicator designed for various asset classes. It combines multiple technical analysis tools to provide buy and sell signals, aiding traders in making informed decisions. This script is suitable for traders who prefer a combination of trend-following and momentum strategies.Features:
RSI-Based Signals: Utilizes a modified Relative Strength Index (RSI) with an extended period of 200 bars for smoothing, providing a less reactive but more stable momentum indicator.
RSI EMA: Applies an Exponential Moving Average (EMA) with a 100-bar period to the RSI, further smoothing the RSI and aiding in the identification of longer-term momentum trends.
ATR for Volatility Analysis: Employs the Average True Range (ATR) over a 100-bar period, adjusted with a multiplier of 1. This is used to gauge market volatility and filter signals based on market dynamics.
Peak and Trough Detection: Detects peaks and troughs in the RSI EMA using refined logic and a lookback period of 33 bars, helping in pinpointing potential reversal points.
Dynamic Buy and Sell Signals: Generates buy signals when a trough is identified, and the RSI is below 50, indicating potential upward momentum. Sell signals are generated at peaks when the RSI is above 50, suggesting possible downward momentum.
Alert Conditions: Includes conditions for buy and sell alerts, making it easier for traders to be notified of potential trading opportunities.
Usage:
This indicator is best suited for traders looking for a blend of trend and momentum analysis. The extended periods used in RSI and EMA calculations make this indicator more suitable for medium to long-term trading strategies. Traders should consider combining this indicator with other forms of analysis (like fundamental analysis or additional technical indicators) for comprehensive trading strategies.
Disclaimer:
Trading involves risk. This script is provided for informational purposes only and should not be considered as financial advice. Traders should always conduct their own due diligence and use the script in a simulated environment before applying it to live trading.
Release Notes
New and improvedRelease Notes
Added backtestingRelease Notes
no buys under emaRelease Notes
Added checkbox for ema filterRelease Notes
Added RSI hard sellRelease Notes
Updated default settingsRelease Notes
fixRelease Notes
updateRelease Notes
updateRelease Notes
Added reason plottingRelease Notes
updated colorsRelease Notes
Added buy if % rise after sellRelease Notes
small updateRelease Notes
fixed small rsi filter bugRelease Notes
bug fixRelease Notes
improved peak and valley detectionRelease Notes
clean up codeRelease Notes
updateRelease Notes
cleaned up codeRelease Notes
updateRelease Notes
updated sma filterRelease Notes
updated defualtsRelease Notes
updated defaultsRelease Notes
working on valley detectionRelease Notes
updateRelease Notes
updateRelease Notes
improved sma filterRelease Notes
updated filterRelease Notes
revertRelease Notes
updated order and colorsRelease Notes
add percent gain to chart indicatorRelease Notes
updated buy triggerRelease Notes
updateRelease Notes
cleaned up codeRelease Notes
updated defaultsRelease Notes
cleaned up codeRelease Notes
updated backtestingRelease Notes
added compound gain reportingRelease Notes
cleaned up codeRelease Notes
moved table to bottomRelease Notes
allow decimals for rsi rise and decrease settingsRelease Notes
Updated reporting for days instead of tradesRelease Notes
fixed bugRelease Notes
bug fixRelease Notes
fixed bugRelease Notes
added in trading fees a multiplied everything all inputs by 10 to make them easier to manipulate decimalsRelease Notes
small updateRelease Notes
updateRelease Notes
small updateRelease Notes
small updateRelease Notes
small updateRelease Notes
small update to hard sellRelease Notes
Added Hard Sell cross typeRelease Notes
Added different threshholds for uptrends and downtrendsDisclaimer
The information and publications are not meant to be, and do not constitute, financial, investment, trading, or other types of advice or recommendations supplied or endorsed by TradingView. Read more in the Terms of Use.