PROTECTED SOURCE SCRIPT
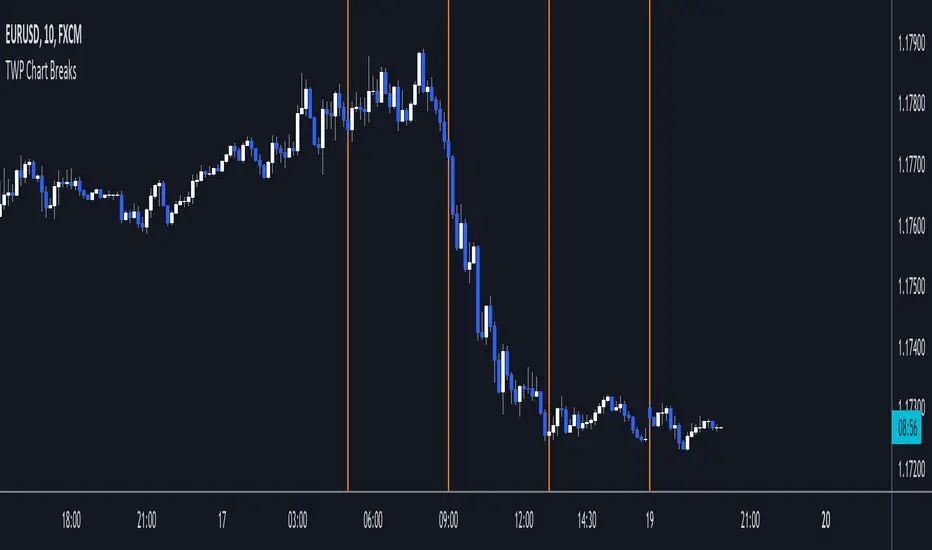
TWP Chart Period Breaks

█ OVERVIEW
This script plots historical and one future vertical line at the higher timeframe.period time mark of your choosing along with the ability to create alerts that ping on the opening of the new bar on the timeframe and during the market session that you have selected. This script adds body to the default "session breaks" that Tradingview provides within the chart settings. It can be a hassle visually keeping track of time when trading but particularly when day trading. Timing is so important and I needed some visual assistance aka some guard rails for my mind to operate in, in order to better execute my trades. I hope this helps you too.
█ CONCEPTS
The script takes some simple steps to plot vertical lines onto your chart with some extra goodies to go the extra yard.
█ FEATURES
1 — Resolution
• Auto / Manual selection
• There is tooltip explains how the automatic time selection operates (see below)
2 — Show Future Period Line
3 — Number of Historical Lines Back
4 — Line Style
• Line color selection
• Line width selection
5 — Alerts
• Market session selection
█ HOW TO USE
• Add it to your chart, select your timeframe, change up your colors, add your alerts (if necessary) and enjoy yourself!
Disclaimer
The information and publications are not meant to be, and do not constitute, financial, investment, trading, or other types of advice or recommendations supplied or endorsed by TradingView. Read more in the Terms of Use.