OPEN-SOURCE SCRIPT
mentfx Triple M
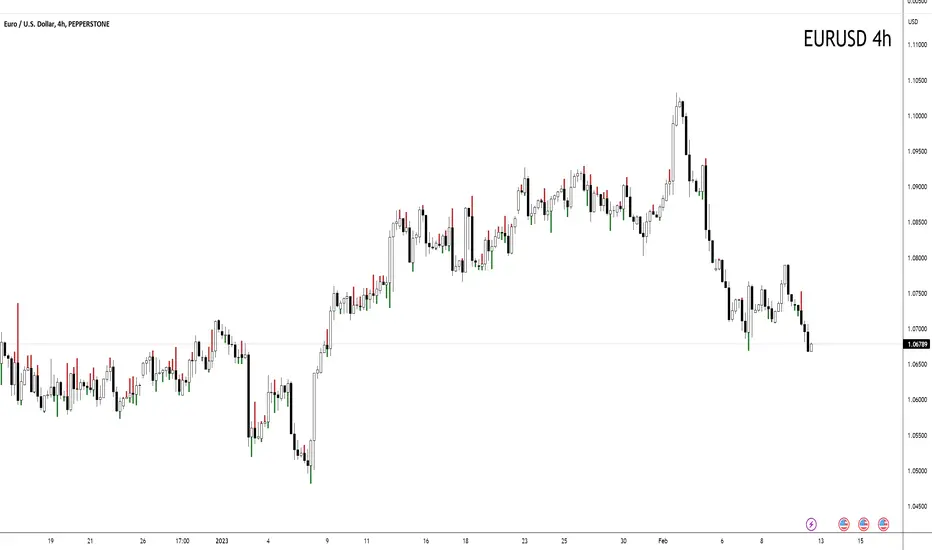
This indicator colors the wick of a candle on any timeframe based on whether the following rules are met:
A colored wick below a candle indicates that the candles low was lower than the previous candles low, and the body of the candle closed above the previous candles low.
A colored wick above a candle indicates that the candles high was higher than the previous candles high, and the body of the candle closed below the previous candles high.
The idea behind this indicator is to fractally see a distribution (colored wick above a candle) or an accumulation (colored wick below a candle) as a confirmation once you have established a directional trend or turning point. This indicator will color any wick that meets these conditions. This indicator is meant more so as an entry confirmation, coupling it with your understanding of turning points, or likely points that price will continue in a direction - this can provide a nice confirmation.
Open-source script
In true TradingView spirit, the author of this script has published it open-source, so traders can understand and verify it. Cheers to the author! You may use it for free, but reuse of this code in publication is governed by House rules. You can favorite it to use it on a chart.
Disclaimer
The information and publications are not meant to be, and do not constitute, financial, investment, trading, or other types of advice or recommendations supplied or endorsed by TradingView. Read more in the Terms of Use.