OPEN-SOURCE SCRIPT
Normalized Hull Moving Average Oscillator w/ Configurations
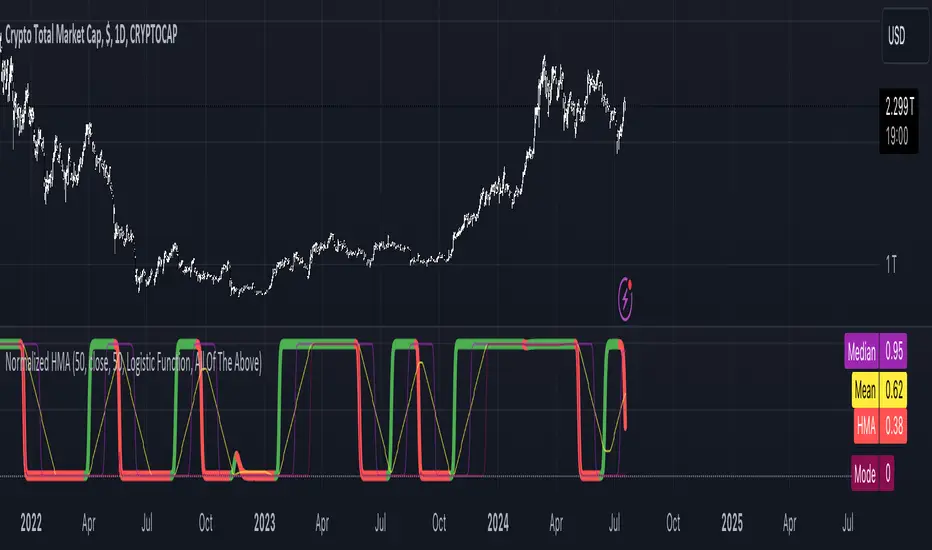
This indicator uniquely uses normalization techniques applied to the Hull Moving Average (HMA) and allows the user to choose between a number of different types of normalization, each with their own advantages. This indicator is one in a series of experiments I've been working on in looking at different methods of transforming data. In particular, this is a more usable example of the power of data transformation, as it takes the Hull Moving Average of Alan Hull and turns it into a powerful oscillating indicator.
The indicator offers multiple types of normalization, each with its own set of benefits and drawbacks. My personal favorites are the Mean Normalization, which turns the data series into one centered around 0, and the Quantile Transformation, which converts the data into a data set that is normally distributed.
I've also included the option of showing the mean, median, and mode of the data over the period specified by the length of normalization. Using this will allow you to gather additional insights into how these transformations affect the distribution of the data series.
Types of Normalization:
1. Z-Score
2. Min-Max
3. Mean Normalization
4. Max Abs Scaler
5. Robust Scaler
6. Feature Scaling to Unit Norm
7. Logistic Function
8. Quantile Transformation
Conclusion
This indicator is a powerful example into how normalization can alter and improve the usability of a data series. Each method offers unique insights and benefits, making this indicator a useful tool for any trader. Try it out, and don't hesitate to reach out if you notice any glaring flaws in the script, room for improvement, or if you just have questions.
The indicator offers multiple types of normalization, each with its own set of benefits and drawbacks. My personal favorites are the Mean Normalization, which turns the data series into one centered around 0, and the Quantile Transformation, which converts the data into a data set that is normally distributed.
I've also included the option of showing the mean, median, and mode of the data over the period specified by the length of normalization. Using this will allow you to gather additional insights into how these transformations affect the distribution of the data series.
Types of Normalization:
1. Z-Score
- Overview: Standardizes the data by subtracting the mean and dividing by the standard deviation.
- Benefits: Centers the data around 0 with a standard deviation of 1, reducing the impact of outliers.
- Disadvantages: Works best on data that is normally distributed
- Notes: Best used with a mid-longer length of transformation.
2. Min-Max
- Overview: Scales the data to fit within a specified range, typically 0 to 1.
- Benefits: Simple and fast to compute, preserves the relationships among data points.
- Disadvantages: Sensitive to outliers, which can skew the normalization.
- Notes: Best used with mid-longer length of transformation.
3. Mean Normalization
- Overview: Subtracts the mean and divides by the range (max - min).
- Benefits: Centers data around 0, making it easier to compare different datasets.
- Disadvantages: Can be affected by outliers, which influence the range.
- Notes: Best used with a mid-longer length of transformation.
4. Max Abs Scaler
- Overview: Scales each feature by its maximum absolute value.
- Benefits: Retains sparsity and is robust to large outliers.
- Disadvantages: Only shifts data to the range [-1, 1], which might not always be desirable.
- Notes: Best used with a mid-longer length of transformation.
5. Robust Scaler
- Overview: Uses the median and the interquartile range for scaling.
- Benefits: Robust to outliers, does not shift data as much as other methods.
- Disadvantages: May not perform well with small datasets.
- Notes: Best used with a longer length of transformation.
6. Feature Scaling to Unit Norm
- Overview: Scales data such that the norm (magnitude) of each feature is 1.
- Benefits: Useful for models that rely on the magnitude of feature vectors.
- Disadvantages: Sensitive to outliers, which can disproportionately affect the norm. Not normally used in this context, though it provides some interesting transformations.
- Notes: Best used with a shorter length of transformation.
7. Logistic Function
- Overview: Applies the logistic function to squash data into the range [0, 1].
- Benefits: Smoothly compresses extreme values, handling skewed distributions well.
- Disadvantages: May not preserve the relative distances between data points as effectively.
- Notes: Best used with a shorter length of transformation. This feature is actually two layered, we first put it through the mean normalization to ensure that it's generally centered around 0.
8. Quantile Transformation
- Overview: Maps data to a uniform or normal distribution using quantiles.
- Benefits: Makes data follow a specified distribution, useful for non-linear scaling.
- Disadvantages: Can distort relationships between features, computationally expensive.
- Notes: Best used with a very long length of transformation.
Conclusion
This indicator is a powerful example into how normalization can alter and improve the usability of a data series. Each method offers unique insights and benefits, making this indicator a useful tool for any trader. Try it out, and don't hesitate to reach out if you notice any glaring flaws in the script, room for improvement, or if you just have questions.
Open-source script
In true TradingView spirit, the author of this script has published it open-source, so traders can understand and verify it. Cheers to the author! You may use it for free, but reuse of this code in publication is governed by House rules. You can favorite it to use it on a chart.
Disclaimer
The information and publications are not meant to be, and do not constitute, financial, investment, trading, or other types of advice or recommendations supplied or endorsed by TradingView. Read more in the Terms of Use.