INVITE-ONLY SCRIPT
BOSS Relative Strength Meter
THE BEST FOREX, STOCKS, COMMODITIES , AND CRYPTO INDICATORS FOR TRADINGVIEW.COM
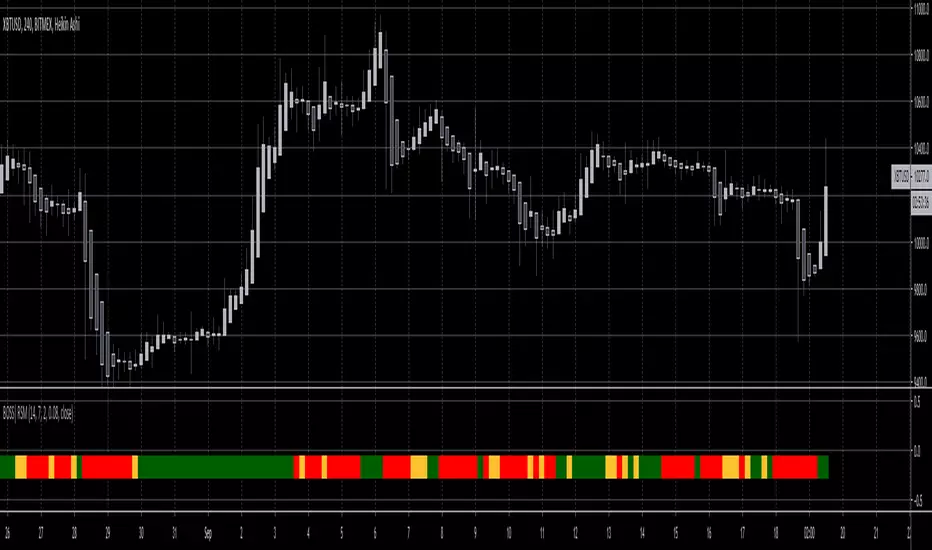
The relative strength meter (RSM) is a momentum indicator that measures the magnitude of recent price changes to evaluate overbought or oversold conditions in the price of a stock or other asset.
The RSM is displayed as a color coded meter.
GREEN: Bullish Uptrend
RED: Bearish Downtrend
YELLOW: Disbursement
Highlights:
Add to any chart or time frame
Prints on the current bar in real time
DOES NOT repaint several bars after the fact
Freedom to Tune
User can change colors
Available Here: https://bosscripts.com/products/relative-strength-meter
7_Day Trial:https://bosscripts.com/collections/7-day-trial/products/7-day-trial-boss-9-indicator-pro-trading-system
🚀 LinkTree: linktr.ee/TradingSafely
📊 SECTOR SPDR ETFs: tradingsafely.net/spdr
🚨 Trade Ideas: tradingsafely.net/trade-ideas/
📈 StockTwits: stocktwits.com/r/TradingSafely
📚 TV Course: bit.ly/32sLUBo
📊 SECTOR SPDR ETFs: tradingsafely.net/spdr
🚨 Trade Ideas: tradingsafely.net/trade-ideas/
📈 StockTwits: stocktwits.com/r/TradingSafely
📚 TV Course: bit.ly/32sLUBo
Invite-only script
Access to this script is restricted to users authorized by the author and usually requires payment. You can add it to your favorites, but you will only be able to use it after requesting permission and obtaining it from its author. Contact TradingSafely for more information, or follow the author's instructions below.
Please note that this is a private, invite-only script that was not analyzed by script moderators. Its compliance to House Rules is undetermined. TradingView does not suggest paying for a script and using it unless you 100% trust its author and understand how the script works. In many cases, you can find a good open-source alternative for free in our Community Scripts.
Want to use this script on a chart?
Warning: please read before requesting access.
Disclaimer
The information and publications are not meant to be, and do not constitute, financial, investment, trading, or other types of advice or recommendations supplied or endorsed by TradingView. Read more in the Terms of Use.