INVITE-ONLY SCRIPT
Bollinger Bands
Updated
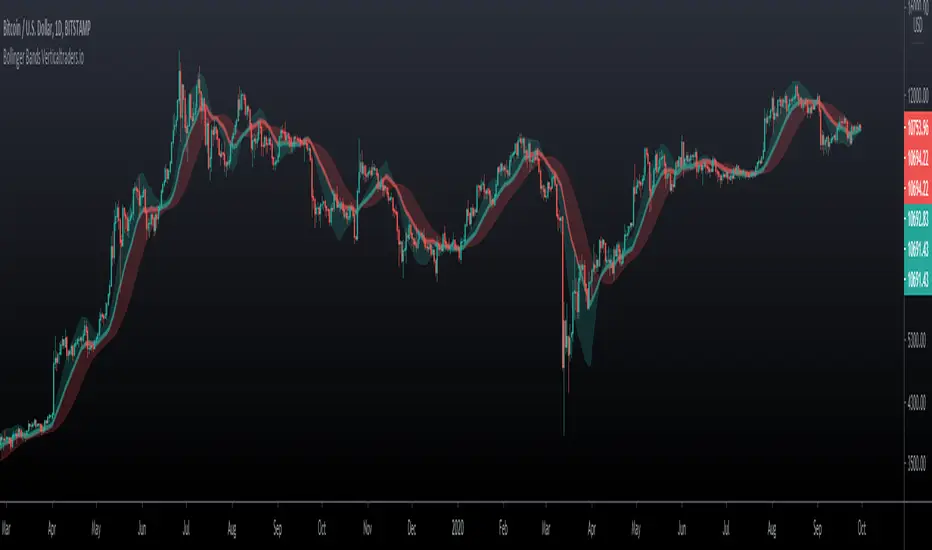
Bollinger bands are calculated from a moving average, creating two curves that involve the price chart, these bands are defined by a standard deviation generally of value 2 with respect to the moving average.
Applications:
- They show the volatility of the market, when the bands are compressed, the volatility decreases, when the bands extend, the volatility increases.
- Trend, with respect to the moving average according to the location of the price corresponding to the positive or negative standard deviation.
Extra functions in this indicator:
- You can use several types of moving averages for the calculation: SMA, EMA, DEMA, TEMA, WMA, VWMA, HullMA, TMA, SMMA, SSMA, etc.
- Background: Shows the zone equivalent to a standard deviation of 1 and 2 with different color.
- Log chart: It can be used on logarithmic price scales, to avoid distortions in those charts.
- Multimeframe: so you can visualize the behavior in different timeframes without changing timeframe.
- Interpolation: Round the curves when viewing larger timeframes.
Multitimeframe example: 1D, select timeframe to Bollinger bands 1W and log chart

Same chart with interpolation

Applications:
- They show the volatility of the market, when the bands are compressed, the volatility decreases, when the bands extend, the volatility increases.
- Trend, with respect to the moving average according to the location of the price corresponding to the positive or negative standard deviation.
Extra functions in this indicator:
- You can use several types of moving averages for the calculation: SMA, EMA, DEMA, TEMA, WMA, VWMA, HullMA, TMA, SMMA, SSMA, etc.
- Background: Shows the zone equivalent to a standard deviation of 1 and 2 with different color.
- Log chart: It can be used on logarithmic price scales, to avoid distortions in those charts.
- Multimeframe: so you can visualize the behavior in different timeframes without changing timeframe.
- Interpolation: Round the curves when viewing larger timeframes.
Multitimeframe example: 1D, select timeframe to Bollinger bands 1W and log chart
Same chart with interpolation
Release Notes
V 2.0🔰 The Best Trading Indicators: links.verticaltraders.io
Invite-only script
Access to this script is restricted to users authorized by the author and usually requires payment. You can add it to your favorites, but you will only be able to use it after requesting permission and obtaining it from its author. Contact Vertical-X for more information, or follow the author's instructions below.
Please note that this is a private, invite-only script that was not analyzed by script moderators. Its compliance to House Rules is undetermined. TradingView does not suggest paying for a script and using it unless you 100% trust its author and understand how the script works. In many cases, you can find a good open-source alternative for free in our Community Scripts.
Want to use this script on a chart?
Warning: please read before requesting access.
Disclaimer
The information and publications are not meant to be, and do not constitute, financial, investment, trading, or other types of advice or recommendations supplied or endorsed by TradingView. Read more in the Terms of Use.