OPEN-SOURCE SCRIPT
Yearly High & Low
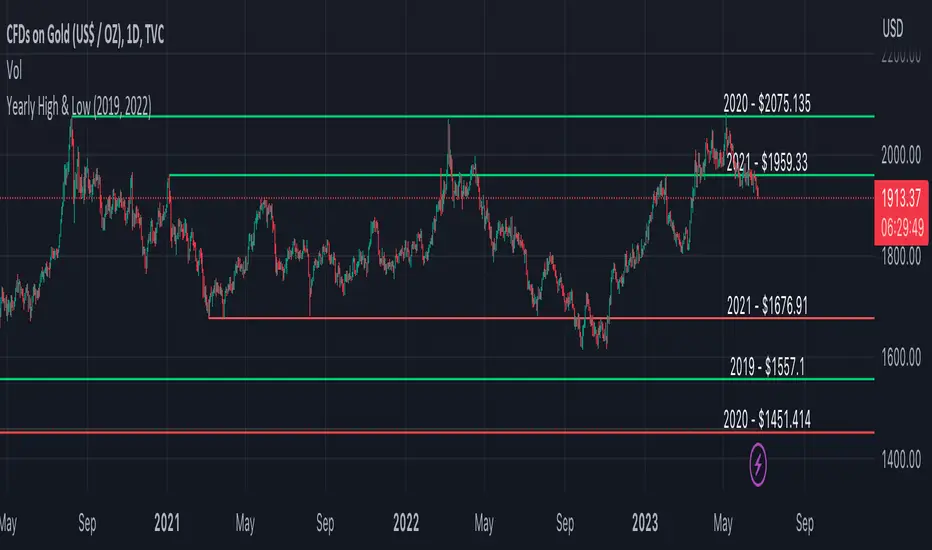
The "Yearly High & Low" indicator shows the yearly high and low prices on the chart, providing you with key price levels for each year. It helps you identify significant price ranges and potential support and resistance areas.
Features:
Start Year and End Year: Define the starting and ending years to display the highs and lows within a specific period.
Show Highs and Lows: Toggle the visibility of the yearly high and low lines to focus on specific price levels.
Show Price: Display the price alongside the yearly high and low labels for precise price level identification.
High Colour and Low Colour: Customise the colour of the yearly high and low lines to match your chart preferences.
Open-source script
In true TradingView spirit, the author of this script has published it open-source, so traders can understand and verify it. Cheers to the author! You may use it for free, but reuse of this code in publication is governed by House rules. You can favorite it to use it on a chart.
Disclaimer
The information and publications are not meant to be, and do not constitute, financial, investment, trading, or other types of advice or recommendations supplied or endorsed by TradingView. Read more in the Terms of Use.