OPEN-SOURCE SCRIPT
Renkoizer[UO]
Updated
Sometimes you need a rough view of what is going on. Ignoring the details could be a blessing. In the configuration, you can change how much you want to ignore
Release Notes
Added plot titlesRelease Notes
Enhanced coloring. Added middle line.Release Notes
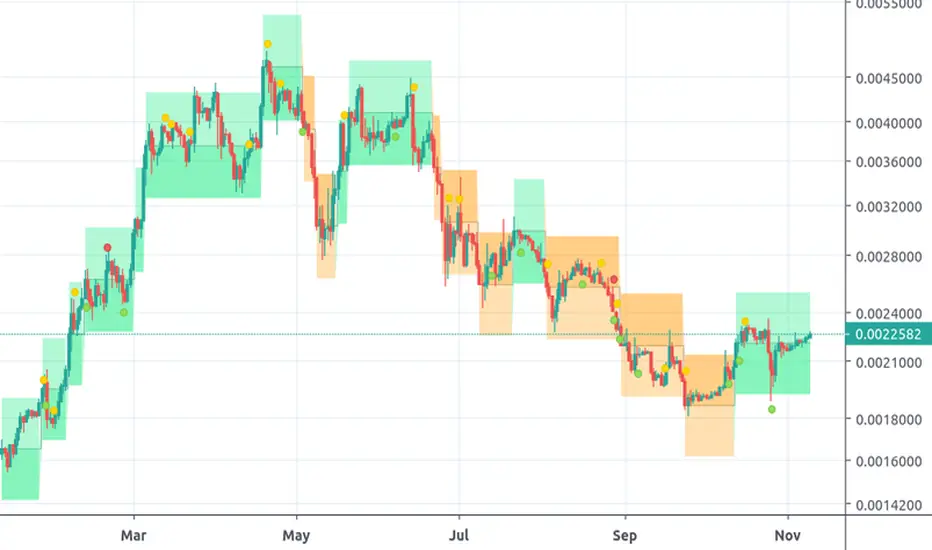
Now, each time.period has a different box size. When you change the time period of the chart, the box size adapts. Thus, you don't end up with a fullscreen filled color. The middle divider line of the box is a resistance/support line most of the time. This resistence/support has a tendency to flip. Support becomes resistance vice versa...
Now, changing the time period you can see support/resistance for that detail level.
Examples:
Release Notes
Set the displayed graph to 1D. It illustrates the bitcoin history better and you know it.Open-source script
In true TradingView spirit, the author of this script has published it open-source, so traders can understand and verify it. Cheers to the author! You may use it for free, but reuse of this code in publication is governed by House rules. You can favorite it to use it on a chart.
Disclaimer
The information and publications are not meant to be, and do not constitute, financial, investment, trading, or other types of advice or recommendations supplied or endorsed by TradingView. Read more in the Terms of Use.