OPEN-SOURCE SCRIPT
RSI with BG
Updated
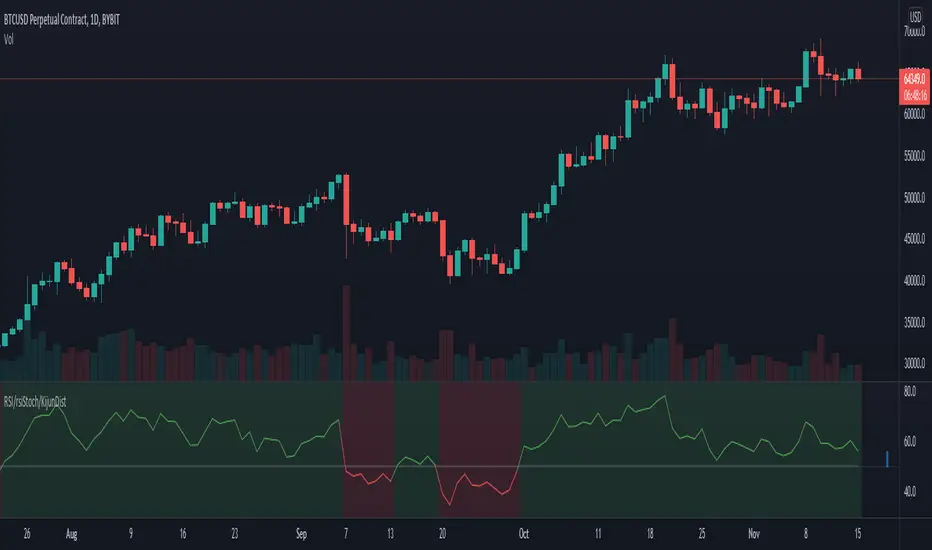
This is a standard RSI indicator with Background colour and the option to draw the Background colour of the next higher timeframe.
Unfortunately, the 3D timeframe is not working properly (weekly background is not displayed). This is the same problem as with the MACD BG study.
Unfortunately, the 3D timeframe is not working properly (weekly background is not displayed). This is the same problem as with the MACD BG study.
Release Notes
This is a standard RSI indicator with Background colour and the option to draw the Background colour of the next higher timeframe. RSI color added for current TF.
Release Notes
Screenshot issue.Release Notes
Added:4H RSI projection for 1H and 2H
optional overbought and oversold levels
optional two experimental signals
(two RSI cross in conjunction with an additional RSI filter and Williams Fractals in conjunction with RSI filter, must be adapted to favorised timeframe, use in conjunction with other indicators )
Release Notes
Screenshot issue. Release Notes
Added 1H bg-projection for 15 min.Release Notes
minor improvementsRelease Notes
MTF histogram added (4H, D, W, M)Release Notes
Some code improvement.Release Notes
Tooltips added.Release Notes
Minor changes.Release Notes
Code updated.Release Notes
Screenshot issue.Release Notes
RSI Stochastic added.Release Notes
Script converted to Pine v5.Kijun distance indicator added.
Release Notes
Repainting option added.Release Notes
Repainting bug fixed.Open-source script
In true TradingView spirit, the author of this script has published it open-source, so traders can understand and verify it. Cheers to the author! You may use it for free, but reuse of this code in publication is governed by House rules. You can favorite it to use it on a chart.
Disclaimer
The information and publications are not meant to be, and do not constitute, financial, investment, trading, or other types of advice or recommendations supplied or endorsed by TradingView. Read more in the Terms of Use.