OPEN-SOURCE SCRIPT
best indicator at 15 minut

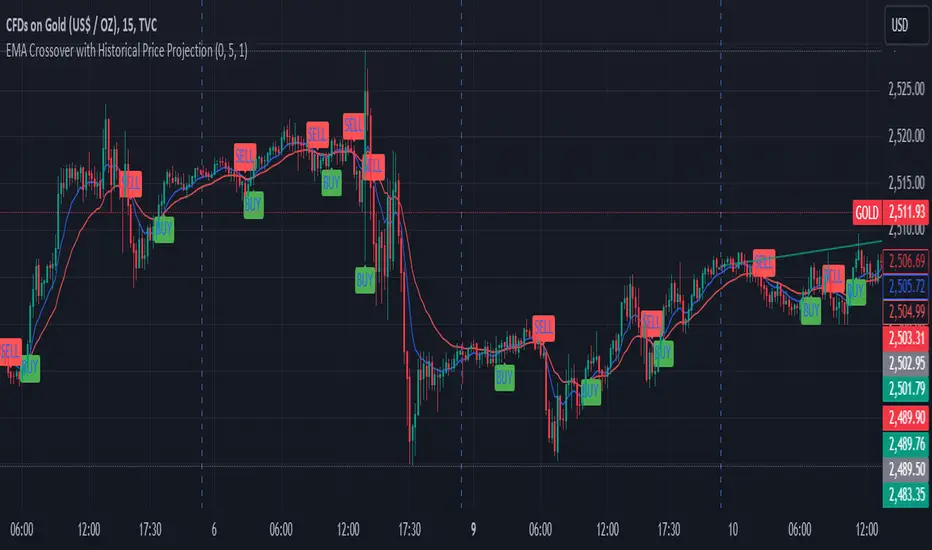
This Pine Script code builds an indicator called EMA Crossover with Historical Price Projection that combines two components:
EMA Crossover Strategy:
EMA 9 and EMA 21: The script calculates two exponential moving averages (EMAs) using the ta.ema() function. The crossover between these EMAs generates buy/sell signals.
A bullish crossover (when EMA 9 crosses above EMA 21) signals a buy.
A bearish crossover (when EMA 9 crosses below EMA 21) signals a sell.
These buy/sell signals are visualized on the chart using the plotshape() function with green and red symbols.
Historical Price Projection:
The code projects future prices based on historical price trends. It takes into account growth factors (user-defined drift percentages) to estimate future prices.
Projection Line: It draws a projection line from the anchor point (set by the user) using historical data. The drift factor allows you to control the projection's slope.
Forecasting Area: It shows an optional area around the projected price, adjusting the width with a user-defined growth factor for the forecast's uncertainty.
Key Sections:
Inputs:
User-defined inputs for controlling the growth factor, line styles, and forecasting area settings.
An anchoring point is provided to determine from which bar the price projection should start.
EMA Crossover:
The crossover conditions for EMA 9 and EMA 21 are defined, and the script generates buy and sell signals at those crossovers.
Historical Price Projection:
It stores the percentage changes between bars in barDeltaPercents.
It projects the future price based on these percentages and the user-defined drift factor.
The projected price is visualized using polyline.new(), and a shaded area can be added to show the range of price possibilities.
Execution Logic:
The script runs when the current time is greater than the anchor point.
If the anchor point is too far back in history, it gives a warning via the showInfoPanel function.
As new bars are confirmed, the drift is calculated, and the projection line and area are updated based on historical price changes.
Overall Flow:
It gathers price data up to 500 bars from the anchor point.
Based on the historical price trend, it forecasts the future price with a projection line and an optional shaded area.
The crossover logic for EMA 9 and 21 provides actionable signals on when to buy or sell.
Open-source script
In true TradingView spirit, the author of this script has published it open-source, so traders can understand and verify it. Cheers to the author! You may use it for free, but reuse of this code in publication is governed by House rules. You can favorite it to use it on a chart.
Disclaimer
The information and publications are not meant to be, and do not constitute, financial, investment, trading, or other types of advice or recommendations supplied or endorsed by TradingView. Read more in the Terms of Use.