OPEN-SOURCE SCRIPT
Anchored Relative Strength
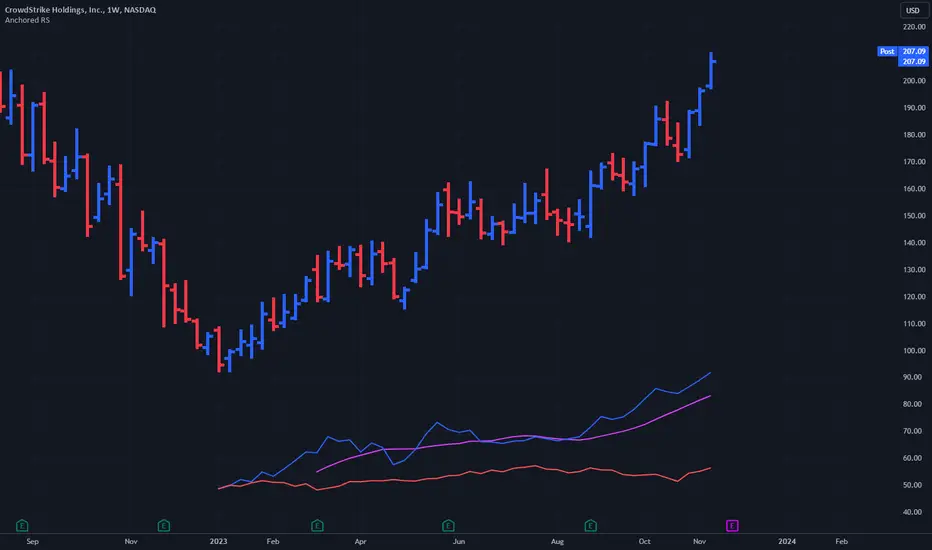
The Anchored Relative Strength (RS) Indicator is a tool designed for traders to compare the performance of a selected stock or security against a benchmark index or another security starting from a specific point in time.
Traditional Relative Strength
The traditional RS line is a popular tool used to compare the performance of a stock, typically calculated as the ratio of the stock's price to a benchmark index's price. It helps identify outperformers and underperformers relative to the market or a specific sector.
The Anchored Approach
The Anchored RS line enhances the traditional concept of the RS line by introducing an anchored approach, where calculations begin from a user-defined date. This feature provides the flexibility to start the comparison from a specific historical event, earnings, market peak, trough, or any date significant to the trader's analysis.
Calculating Relative Strength
The RS value is calculated by dividing the close price of the chosen stock by the close price of the comparative symbol (SPX by default). This calculation is performed for each bar since the Anchor Date.
Indicator Features
🔶Custom Start Date
🔶Custom Comparison Symbol
🔶RS Line Moving Average
🔶Comparison Symbol Line
🔶Customize Colors & Appearance
Users can change the anchor date simply by clicking on the indicator and dragging the anchor point.
Trusted Pine programmer. Send me a message for script development.
Open-source script
In true TradingView spirit, the author of this script has published it open-source, so traders can understand and verify it. Cheers to the author! You may use it for free, but reuse of this code in publication is governed by House rules. You can favorite it to use it on a chart.
Disclaimer
The information and publications are not meant to be, and do not constitute, financial, investment, trading, or other types of advice or recommendations supplied or endorsed by TradingView. Read more in the Terms of Use.