OPEN-SOURCE SCRIPT
Plot Break-even Price
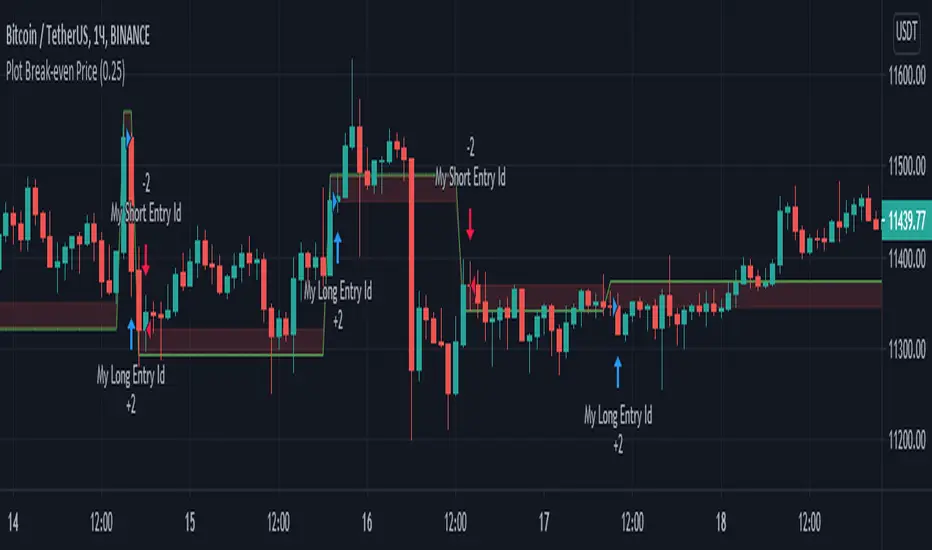
This indicator simply plots your entry price and the break-even point (green line). Area between the entry price and the break-even point will “eat” you profit by exchange fees. You can use the green line to lock your break-even point. I do not recommend using this strategy for trading, because the entry logic is based on SMA crosses. However, this script could be used within you own strategy to plot the break-even point.
For example, there is 0.1% Maker fee and 0.1% Taker fee at Binance spot exchange. You need to sum up those two fees to calculate the break-even point. Every exit above/below the green line will guarantee a profit (in our case it means 0.2% above the entry price for long position and 0.2% below the entry price for short position).
For example, there is 0.1% Maker fee and 0.1% Taker fee at Binance spot exchange. You need to sum up those two fees to calculate the break-even point. Every exit above/below the green line will guarantee a profit (in our case it means 0.2% above the entry price for long position and 0.2% below the entry price for short position).
Open-source script
In true TradingView spirit, the author of this script has published it open-source, so traders can understand and verify it. Cheers to the author! You may use it for free, but reuse of this code in publication is governed by House rules. You can favorite it to use it on a chart.
Disclaimer
The information and publications are not meant to be, and do not constitute, financial, investment, trading, or other types of advice or recommendations supplied or endorsed by TradingView. Read more in the Terms of Use.