PROTECTED SOURCE SCRIPT
Updated Logarithmic Trend line
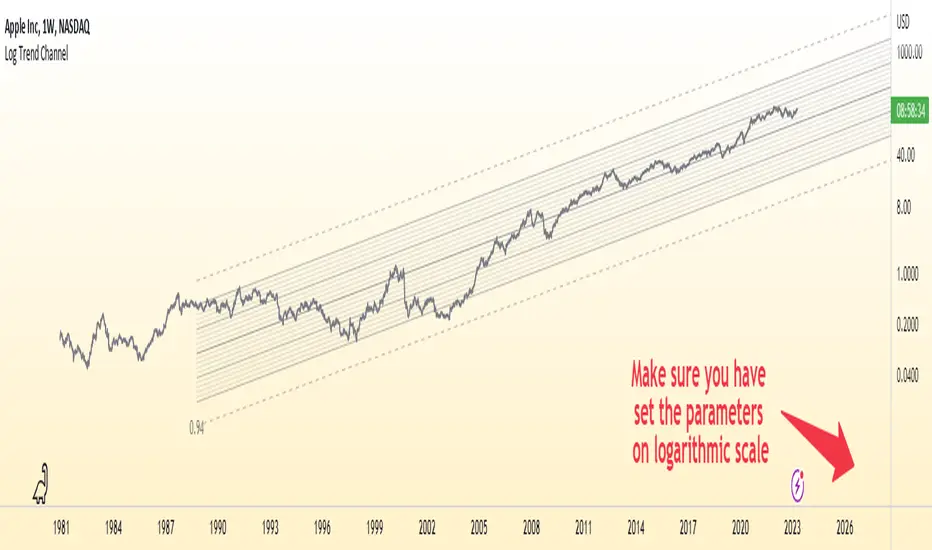
Logarithmic Trend line is used to model data where growth or decay accelerates rapidly at first and then slows over time.
This model is for the long term series data (such as 10 or 20 years time span).
Technical issues
*The user have to pan over the chart from the beginning to the end of the study range (such as 10 years of bars) so the pine script could generate those lines on the chart.
*If on the chart the number of bar is less than the lookback period, it won't generate any lines as well.
Release Notes
++ Linear Regression from 0.2/-0.2 to 3/-3 deviations using Log Scale.Release Notes
I changed the color, location and precision of the Pearson 's R to make it more visible.Release Notes
I changed the color ;)Release Notes
Colors changedRelease Notes
count set to 300Release Notes
count set back to 250 :)Protected script
This script is published as closed-source. However, you can use it freely and without any limitations – learn more here.
The trend is your friend, until it's not...
Disclaimer
The information and publications are not meant to be, and do not constitute, financial, investment, trading, or other types of advice or recommendations supplied or endorsed by TradingView. Read more in the Terms of Use.
Protected script
This script is published as closed-source. However, you can use it freely and without any limitations – learn more here.
The trend is your friend, until it's not...
Disclaimer
The information and publications are not meant to be, and do not constitute, financial, investment, trading, or other types of advice or recommendations supplied or endorsed by TradingView. Read more in the Terms of Use.