OPEN-SOURCE SCRIPT
Intraday Range Calculator
Updated
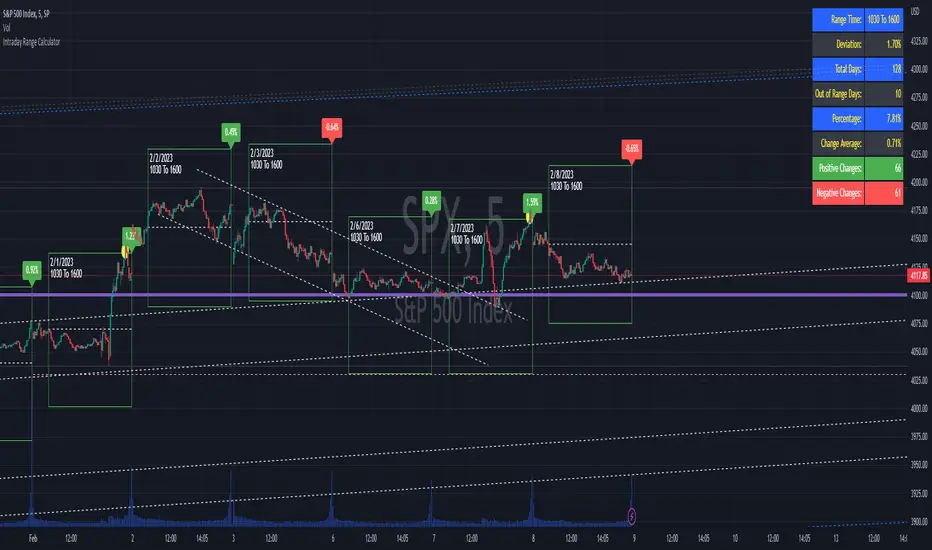
This indicator shows an easy way to determine if the stock, index or ETF ended within a configurable intraday range.
This solution is ideal for those who study and like Iron Condors or Iron Butterflies strategies.
Results:
If the square is red, it means that the selected deviation limits have been exceeded within the chosen times.
If the square is green, the price stayed within the pre-set limits.
A yellow circle marks the moment when the price leaves the range, either by the upper band or by the lower band.
In the last bar a label with the test results will be displayed.
Settings:
In the configuration there are three fields:
1. Deviation [%]: is the range in percentage that the price can move up or down from the start time to the end time.
2. Begin Time: is the time (in 24h or military format) where the process begins.
3. End Time: is the time (in 24h or military format) where the process ends.
Example:
* for the time 11:00 am, you must enter "1100"
* for the time 2:45pm, you must enter "1445"
Important:
The selected timeframe must be less than 1 hour and Extended Trading Hours in the lower left corner), otherwise the indicator may not show results.
Later I will make an improvement to solve these inconveniences.
Release Notes
Update 2/8/2023Adding:
* Dashboard in table
* Date and time in each box range
* Range changes in each box range
Open-source script
In true TradingView spirit, the author of this script has published it open-source, so traders can understand and verify it. Cheers to the author! You may use it for free, but reuse of this code in publication is governed by House rules. You can favorite it to use it on a chart.
Disclaimer
The information and publications are not meant to be, and do not constitute, financial, investment, trading, or other types of advice or recommendations supplied or endorsed by TradingView. Read more in the Terms of Use.