OPEN-SOURCE SCRIPT
Squeeze Box [DW]
Updated

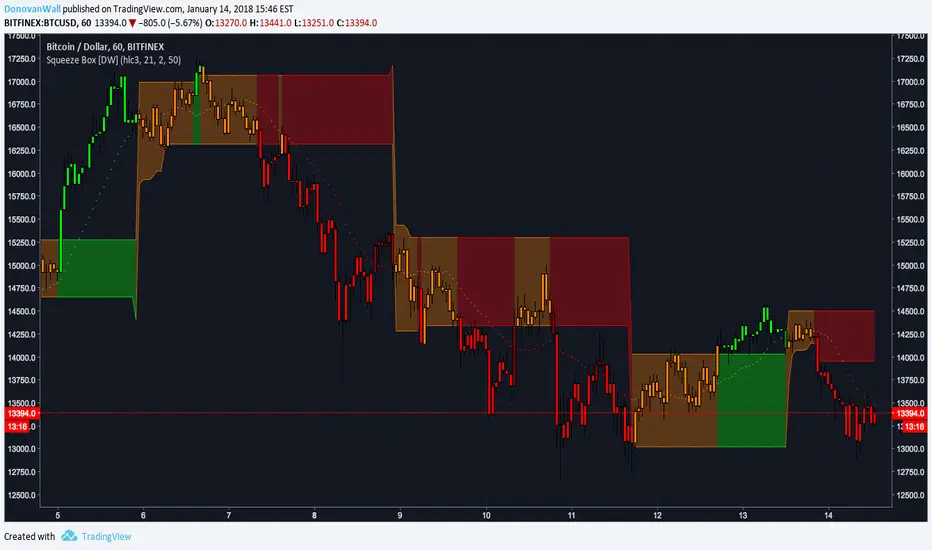
This is an experimental study designed using data from Bollinger Bands to determine price squeeze ranges and active levels of support and resistance.
First, a set of Bollinger Bands using a Coefficient of Variation weighted moving average as the basis is calculated.
Then, the relative percentage of current bandwidth to maximum bandwidth over the specified sampling period determines the relative squeeze.
The box is outlined by drawing the current highest and lowest source value over the sampling period whenever a squeeze is active.
I've included the COVWMA in the visualization for additional confirmation of price activity.
Custom Bar color scheme is included.
Release Notes
Updates:Added alternate moving average types. The available moving averages now in this script are:
-Exponential Moving Average
-Simple Moving Average
-Smoothed Moving Average
-Weighted Moving Average
-Volume Weighted Moving Average
-Least Squares Moving Average
-Arnaud Legoux Moving Average
-Hull Moving Average
-Coefficient of Variation Weighted Moving Average
-Fractal Adaptive Moving Average
-Kaufman's Adaptive Moving Average
Refined the color scheme for both bar colors and the moving averages.
Please note: Each moving average type generates different box values, so play around with them and find the one that works best for you.
Open-source script
In true TradingView spirit, the author of this script has published it open-source, so traders can understand and verify it. Cheers to the author! You may use it for free, but reuse of this code in publication is governed by House rules. You can favorite it to use it on a chart.
For my full list of premium tools, check the blog:
wallanalytics.com/
Reach out on Telegram:
t.me/DonovanWall
wallanalytics.com/
Reach out on Telegram:
t.me/DonovanWall
Disclaimer
The information and publications are not meant to be, and do not constitute, financial, investment, trading, or other types of advice or recommendations supplied or endorsed by TradingView. Read more in the Terms of Use.