INVITE-ONLY SCRIPT
MAD Volatility Percentile
Updated

Mean Absolute Deviation (MAD) is a statistical measure that tells you how spread out or variable a set of data points is. It calculates the average distance of each data point from the mean (average) of the data set. MAD helps you understand how much individual values differ from the average value. It's a way to measure the overall "average distance" of the data points from the center point.
Indicator Overview:
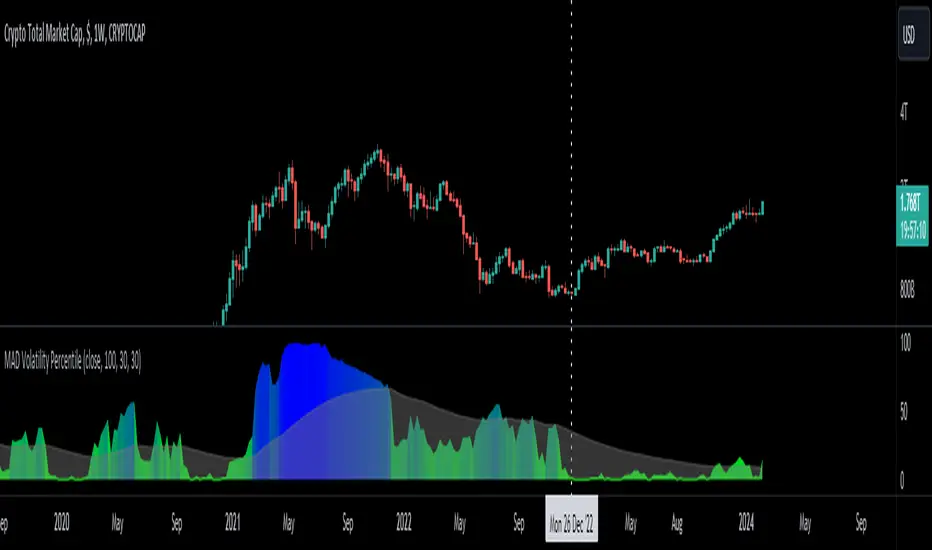
This indicator measures market volatility using Mean Absolute Deviation of returns. The MAD Volatility Percentile Indicator calculates and represents market volatility as a percentile. The lower the percentile, the lower the volatility, and the higher the percentile value is, the higher the volatility is.
Understanding Volatility:
Lower percentiles signify a lower volatility market environment, reflecting reduced volatility, while higher percentiles indicate increased volatility and significant price movements. The indicator also comes with an SMA to see when the burst of higher volatility occur. You can also change the sample length on the indicators option. You can consider a big move occurring when the percentile value is above the SMA.
Application
Generally when the Mean Absolute Deviation Volatility Percentile is low, then this means that the volatility is low and a expansion could happen soon, which means a big move will occur soon. This indicator can also protect you from entering a trade that will not have any significant moves for a while.
This indicator is not a directional indicator but it can be applied with directional indicators, and is extremely versatile. For example you can use it with momentum indicators and if there is low volatility and bullish momentum then this can be a signal to potentially place a long position.
Features:

This is an example of the alerts that the indicator comes with.

Indicator Overview:
This indicator measures market volatility using Mean Absolute Deviation of returns. The MAD Volatility Percentile Indicator calculates and represents market volatility as a percentile. The lower the percentile, the lower the volatility, and the higher the percentile value is, the higher the volatility is.
Understanding Volatility:
Lower percentiles signify a lower volatility market environment, reflecting reduced volatility, while higher percentiles indicate increased volatility and significant price movements. The indicator also comes with an SMA to see when the burst of higher volatility occur. You can also change the sample length on the indicators option. You can consider a big move occurring when the percentile value is above the SMA.
Application
Generally when the Mean Absolute Deviation Volatility Percentile is low, then this means that the volatility is low and a expansion could happen soon, which means a big move will occur soon. This indicator can also protect you from entering a trade that will not have any significant moves for a while.
This indicator is not a directional indicator but it can be applied with directional indicators, and is extremely versatile. For example you can use it with momentum indicators and if there is low volatility and bullish momentum then this can be a signal to potentially place a long position.
Features:
- The percentile length sets the lookback of the percentile which calculates the percentile of the Mean Absolute Deviation of returns.
- Sample length: Gets the volatility sample (returns)
- SMA Length: The SMA of the percentile. Used to find when a move can be considered as an "expansion"
- Alerts: You can also enable color alerts that flash when the volatility is at extremely low levels which can signify that a big move could happen soon.
This is an example of the alerts that the indicator comes with.
Release Notes
Description UpdateRelease Notes
Improved the volatility calculationsInvite-only script
Access to this script is restricted to users authorized by the author and usually requires payment. You can add it to your favorites, but you will only be able to use it after requesting permission and obtaining it from its author. Contact Traders_Endeavors for more information, or follow the author's instructions below.
TradingView does not suggest paying for a script and using it unless you 100% trust its author and understand how the script works. In many cases, you can find a good open-source alternative for free in our Community Scripts.
Author's instructions
″Get access here: https://www.patreon.com/user?u=80987417
Want to use this script on a chart?
Warning: please read before requesting access.
Link Tree: linktr.ee/tradersendeavors
Access our indicators: patreon.com/user?u=80987417
Access our indicators: patreon.com/user?u=80987417
Disclaimer
The information and publications are not meant to be, and do not constitute, financial, investment, trading, or other types of advice or recommendations supplied or endorsed by TradingView. Read more in the Terms of Use.