OPEN-SOURCE SCRIPT
US Treasury Constant Maturity Spreads
Updated

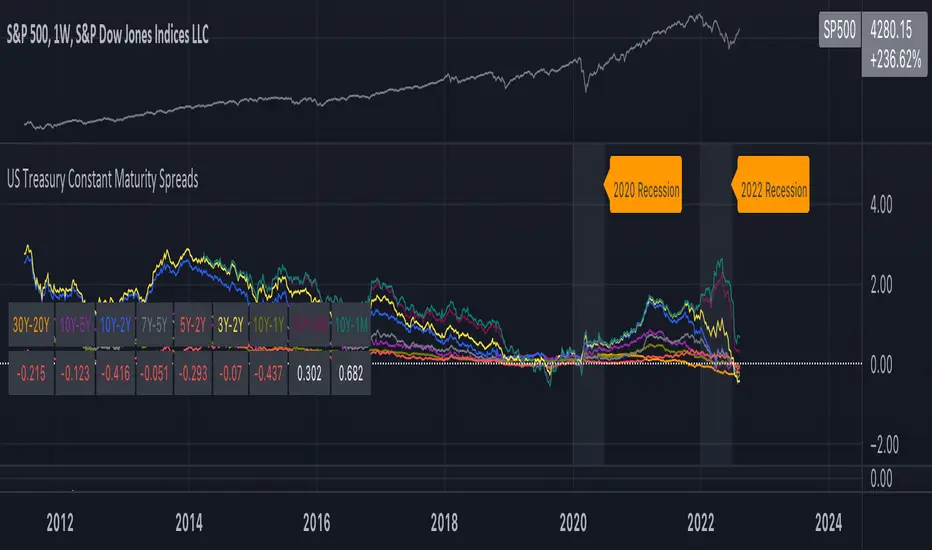
Plots and tabulates constant maturity treasury yield spreads
// colours per curve type for the plots and table headers
C_30Y_20Y=color.orange
C_10Y_5Y=color.purple
C_10Y_2Y=color.blue
C_7Y_5Y=color.gray
C_5Y_2Y=color.red
C_3Y_2Y=color.yellow
C_10Y_1Y=color.olive
// colours per curve type for the plots and table headers
C_30Y_20Y=color.orange
C_10Y_5Y=color.purple
C_10Y_2Y=color.blue
C_7Y_5Y=color.gray
C_5Y_2Y=color.red
C_3Y_2Y=color.yellow
C_10Y_1Y=color.olive
Release Notes
Added spreads for short end of the curve, 10yr minus 3m, 10yr minus 1mRelease Notes
Changes:- Added labels for recession bands.
- Adjusted visibility of 2009 recession band.
Identifying colours:
- Orange = 30Y minus 20Y
- Purple = 10Y minus 5Y
- Blue = 10Y minus 2Y
- Grey = 7Y minus 5Y
- Red = 5Y minus 2Y
- Yellow = 3Y minus 2Y
- Olive = 10Y minus 1Y
- Maroon = 10Y minus 3M
- Teal = 10Y minus 1M
Release Notes
Changes as follows:- Minor display and visual changes for readability - moved spread table, font
- Updated to common markup lib v4
Release Notes
Changes a follows:- Added parameter that allows user to consider two consecutive quarters of negative GDP growth as a recession. Defaults to false but can be set on Inputs dialog.
Release Notes
Changes a follows:- Minor UI changes to allow plot and spread table colours to be changed via the indicator’s settings tool
- Increased precision on the y-scale
- General refactoring and code hygiene.
Release Notes
Changes as follows:- Improved the visual for recession band rendering
- Introduced user defined types and refactored code
- Added 2001
Open-source script
In true TradingView spirit, the author of this script has published it open-source, so traders can understand and verify it. Cheers to the author! You may use it for free, but reuse of this code in publication is governed by House rules. You can favorite it to use it on a chart.
Disclaimer
The information and publications are not meant to be, and do not constitute, financial, investment, trading, or other types of advice or recommendations supplied or endorsed by TradingView. Read more in the Terms of Use.