OPEN-SOURCE SCRIPT
Updated IV/HV Ratio's [Nic]
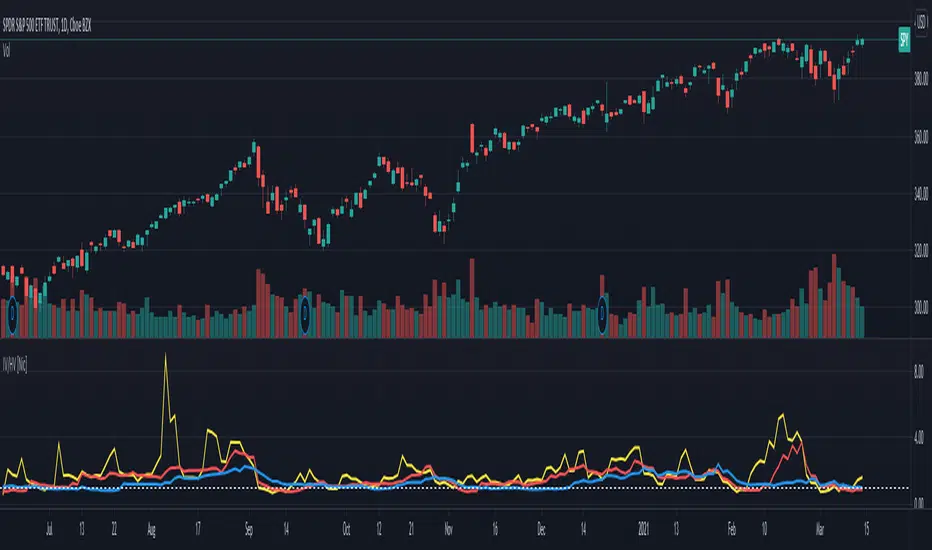
IV is implied volatility
HV is historic realized volatility
Seneca teaches that we often suffer more in our minds than in reality, and the same is true with the stock market. This indicator can help identify when people are over paying for implied volatility relative to real volatility . This means that short sellers are over paying for puts and can be squeezed into covering their positions, resulting in a massive rally.
The indicator can track this spread over many time frames, when the short time frame is much higher than the lower time frames, consider it a signal-of-interest.
Release Notes
improved lookup of default ticker to include more vix indices.Release Notes
Added better docs in the settingsOpen-source script
In true TradingView spirit, the creator of this script has made it open-source, so that traders can review and verify its functionality. Kudos to the author! While you can use it for free, remember that republishing the code is subject to our House Rules.
For quick access on a chart, add this script to your favorites — learn more here.
Disclaimer
The information and publications are not meant to be, and do not constitute, financial, investment, trading, or other types of advice or recommendations supplied or endorsed by TradingView. Read more in the Terms of Use.
Open-source script
In true TradingView spirit, the creator of this script has made it open-source, so that traders can review and verify its functionality. Kudos to the author! While you can use it for free, remember that republishing the code is subject to our House Rules.
For quick access on a chart, add this script to your favorites — learn more here.
Disclaimer
The information and publications are not meant to be, and do not constitute, financial, investment, trading, or other types of advice or recommendations supplied or endorsed by TradingView. Read more in the Terms of Use.