OPEN-SOURCE SCRIPT
Salty GRaB Wave with Highlights for Squeeze CCI-Arrows SlowStoch
Updated
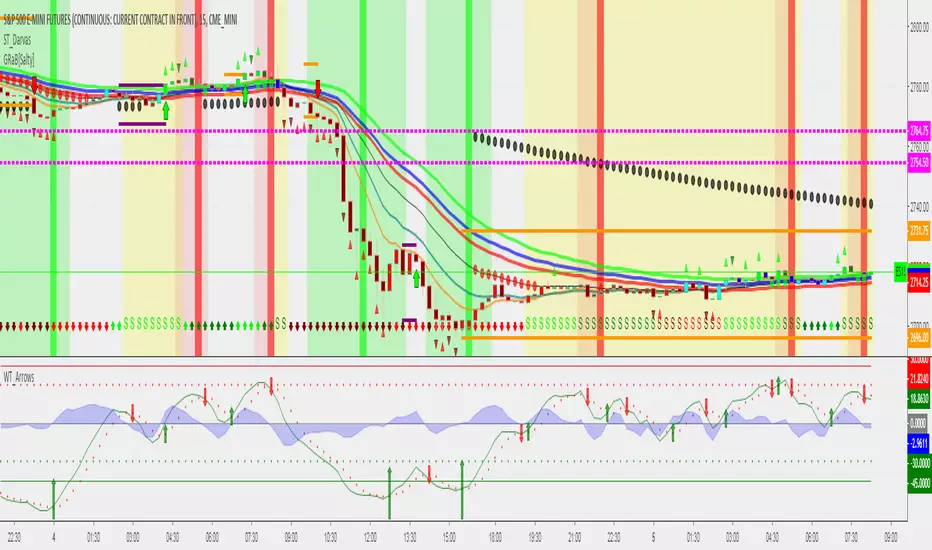
This indicator shows GRaB candles and allows several moving averages to be displayed at the same time.
It uses background coloring to identify momentum shifts. Wide bands of color can be used to identify trends while short bands of color can be used to identify reversals.
It has arrows above or below the candles to show CCI values above 100 or below -100 with the arrow pointing in the direction of the momentum.
It has red background coloring to show slow stochastic Overbought ranges and dark red signals indicating a cross of the fast and slow lines.
It has green background coloring to show slow stochastic Oversold ranges and dark green signals indicating a cross of the fast and slow lines.
It has yellow background to show squeezes with additional Squeeze information shown at the bottom of the chart in the form of letters and momentum arrows.
Release Notes
Added support for 2 sets of Propulsion Dots.Open-source script
In true TradingView spirit, the author of this script has published it open-source, so traders can understand and verify it. Cheers to the author! You may use it for free, but reuse of this code in publication is governed by House rules. You can favorite it to use it on a chart.
Disclaimer
The information and publications are not meant to be, and do not constitute, financial, investment, trading, or other types of advice or recommendations supplied or endorsed by TradingView. Read more in the Terms of Use.