PROTECTED SOURCE SCRIPT
OrderFlow [Probabilities] | Fractalyst
Updated
What's the indicator's purpose and functionality?
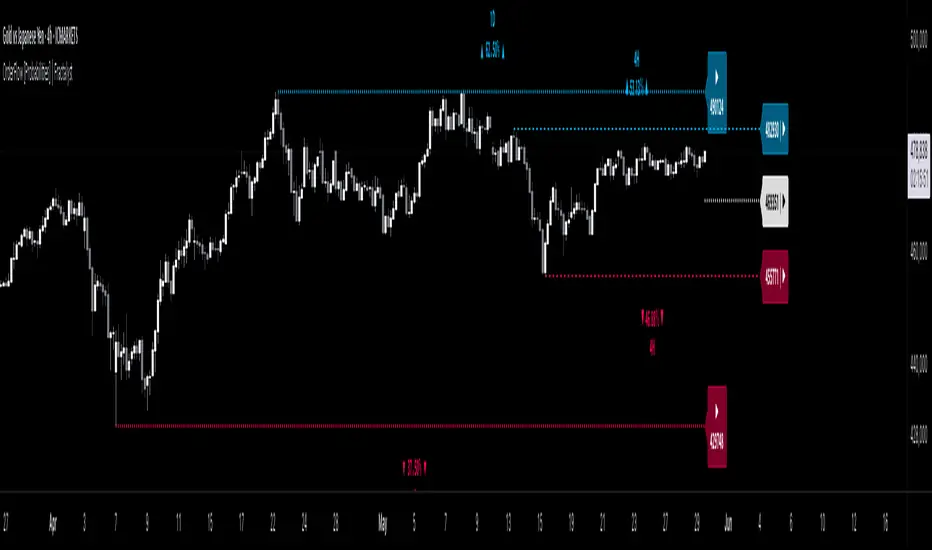
The indicator is designed to incorporate probabilities with buyside and sellside liquidity, as well as premium and discount ranges within the market. It also provides traders with a multi-timeframe functionality for observing liquidity levels and probabilities across two timeframes without the need to manually switch between them.
These levels are often used in smart money trading concepts for identifying key areas of interest, such as potential reversal points, areas of accumulation or distribution, and zones of high liquidity.
----
What's the purpose of these levels? What are the underlying calculations?
1. Understanding Swing highs and Swing Lows
Swing High: A Swing High is formed when there is a high with 2 lower highs to the left and right.
Swing Low: A Swing Low is formed when there is a low with 2 higher lows to the left and right.

2. Understanding the purpose and the underlying calculations behind Buyside, Sellside and Equilibrium levels.

3. Identifying Discount and Premium Zones.

4. Importance of Risk-Reward in Premium and Discount Ranges

----
How does the script calculate probabilities?
The script calculates the probability of each liquidity level individually. Here's the breakdown:
1. Upon the formation of a new range, the script waits for the price to reach and tap into equilibrium or the 50% level. Status: "⏸" - Inactive
2. Once equilibrium is tapped into, the equilibrium status becomes activated and it waits for either liquidity side to be hit. Status: "▶" - Active
3. If the buyside liquidity is hit, the script adds to the count of successful buyside liquidity occurrences. Similarly, if the sellside is tapped, it records successful sellside liquidity occurrences.
5. Finally, the number of successful occurrences for each side is divided by the overall count individually to calculate the range probabilities.

Note: The calculations are performed independently for each directional range. A range is considered bearish if the previous breakout was through a sellside liquidity. Conversely, a range is considered bullish if the most recent breakout was through a buyside liquidity.

----
What does the multi-timeframe functionality offer?
Enabling and selecting a higher timeframe in the indicator's user-input settings allows you to access not only the current range information but also the liquidity sides, status, price levels, and probabilities of a higher timeframe without needing to switch between timeframes and mark up the levels manually.
----
What are the multi-timeframe underlying calculations?
The script uses the same calculations (mentioned above) and requests the data such as price levels, bar time, probabilities and booleans from the user-input timeframe.

Non-repainting Security Function with Lookahead ON
----
How to use the indicator?
1. Add the indicator to your TradingView chart.
2. Choose the pair you want to analyze/trade.
3. Enable the HTF in user-input settings and choose a timeframe as for your higher timeframe bias.
4. (Important): Ensure that the probabilities on both timeframes are aligned in one direction. If not, switch between timeframes until you find a pair of timeframes that are in line with each other and have higher probabilities on one liquidity side.
For Swing traders:
Use Hourly timeframes (1H/2H/4H/8H/12H) as your current timeframe and 1D/3D/1W/2W for your higher timeframe (HTF).
Entry: Hourly Equilibrium level. (Limit order)
Stoploss: Place it on the side where the probability is lower than 50%.
Break-even level/TP1: Hourly breakout of the liquidity.
TP2: Target the Higher Timeframe (HTF) liquidity level where the probability is higher than 50%.
2H/1D BTCUSD

For Day traders:
Use minutely timeframes (5m/15m/30m) as your current timeframe and 1H/2H/4H/8H/12H for your higher timeframe (HTF).
Entry: Minutely Equilibrium level. (Limit order)
Stoploss: Place it on the side where the probability is lower than 50%.
Break-even level/TP1: Minutely breakout of the liquidity.
TP2: Target the Higher Timeframe (HTF) liquidity level where the probability is higher than 50%.
1H/5mBTCUSD

----
User-input settings and customizations

----
What makes this indicator original?
1. Real-time calculation of probabilities directly on your charts.
2. Multi-timeframe functionality, enabling effortless observation of liquidity levels and probabilities across two timeframes.
3. Status label for clear identification of whether price has reached equilibrium.
4. All levels are updated only upon candle closure above or below liquidity levels, ensuring it remains a non-repainting indicator.
----
Terms and Conditions | Disclaimer
Our charting tools are provided for informational and educational purposes only and should not be construed as financial, investment, or trading advice. They are not intended to forecast market movements or offer specific recommendations. Users should understand that past performance does not guarantee future results and should not base financial decisions solely on historical data.
The indicator is designed to incorporate probabilities with buyside and sellside liquidity, as well as premium and discount ranges within the market. It also provides traders with a multi-timeframe functionality for observing liquidity levels and probabilities across two timeframes without the need to manually switch between them.
These levels are often used in smart money trading concepts for identifying key areas of interest, such as potential reversal points, areas of accumulation or distribution, and zones of high liquidity.
----
What's the purpose of these levels? What are the underlying calculations?
1. Understanding Swing highs and Swing Lows
Swing High: A Swing High is formed when there is a high with 2 lower highs to the left and right.
Swing Low: A Swing Low is formed when there is a low with 2 higher lows to the left and right.
2. Understanding the purpose and the underlying calculations behind Buyside, Sellside and Equilibrium levels.
3. Identifying Discount and Premium Zones.
4. Importance of Risk-Reward in Premium and Discount Ranges
----
How does the script calculate probabilities?
The script calculates the probability of each liquidity level individually. Here's the breakdown:
1. Upon the formation of a new range, the script waits for the price to reach and tap into equilibrium or the 50% level. Status: "⏸" - Inactive
2. Once equilibrium is tapped into, the equilibrium status becomes activated and it waits for either liquidity side to be hit. Status: "▶" - Active
3. If the buyside liquidity is hit, the script adds to the count of successful buyside liquidity occurrences. Similarly, if the sellside is tapped, it records successful sellside liquidity occurrences.
5. Finally, the number of successful occurrences for each side is divided by the overall count individually to calculate the range probabilities.
Note: The calculations are performed independently for each directional range. A range is considered bearish if the previous breakout was through a sellside liquidity. Conversely, a range is considered bullish if the most recent breakout was through a buyside liquidity.
----
What does the multi-timeframe functionality offer?
Enabling and selecting a higher timeframe in the indicator's user-input settings allows you to access not only the current range information but also the liquidity sides, status, price levels, and probabilities of a higher timeframe without needing to switch between timeframes and mark up the levels manually.
----
What are the multi-timeframe underlying calculations?
The script uses the same calculations (mentioned above) and requests the data such as price levels, bar time, probabilities and booleans from the user-input timeframe.
Non-repainting Security Function with Lookahead ON
----
How to use the indicator?
1. Add the indicator to your TradingView chart.
2. Choose the pair you want to analyze/trade.
3. Enable the HTF in user-input settings and choose a timeframe as for your higher timeframe bias.
4. (Important): Ensure that the probabilities on both timeframes are aligned in one direction. If not, switch between timeframes until you find a pair of timeframes that are in line with each other and have higher probabilities on one liquidity side.
For Swing traders:
Use Hourly timeframes (1H/2H/4H/8H/12H) as your current timeframe and 1D/3D/1W/2W for your higher timeframe (HTF).
Entry: Hourly Equilibrium level. (Limit order)
Stoploss: Place it on the side where the probability is lower than 50%.
Break-even level/TP1: Hourly breakout of the liquidity.
TP2: Target the Higher Timeframe (HTF) liquidity level where the probability is higher than 50%.
2H/1D
For Day traders:
Use minutely timeframes (5m/15m/30m) as your current timeframe and 1H/2H/4H/8H/12H for your higher timeframe (HTF).
Entry: Minutely Equilibrium level. (Limit order)
Stoploss: Place it on the side where the probability is lower than 50%.
Break-even level/TP1: Minutely breakout of the liquidity.
TP2: Target the Higher Timeframe (HTF) liquidity level where the probability is higher than 50%.
1H/5m
----
User-input settings and customizations
----
What makes this indicator original?
1. Real-time calculation of probabilities directly on your charts.
2. Multi-timeframe functionality, enabling effortless observation of liquidity levels and probabilities across two timeframes.
3. Status label for clear identification of whether price has reached equilibrium.
4. All levels are updated only upon candle closure above or below liquidity levels, ensuring it remains a non-repainting indicator.
----
Terms and Conditions | Disclaimer
Our charting tools are provided for informational and educational purposes only and should not be construed as financial, investment, or trading advice. They are not intended to forecast market movements or offer specific recommendations. Users should understand that past performance does not guarantee future results and should not base financial decisions solely on historical data.
- By continuing to use our charting tools, the user acknowledges and accepts the Terms and Conditions outlined in this legal disclaimer.
Release Notes
- Introduced a Multifunctional Bias Table - Enabling traders to grasp the probabilities and bias of higher timeframes.- Code optimization for enhanced script performance.
Release Notes
- Implemented specialized filters to optimize probability calculations, particularly when the break bar aligns with Equilibrium.- Enhanced accuracy by extending the maximum bars back within the code logic.
- Improved script efficiency by utilizing line/labels arrays, resulting in faster loading times, especially while using multi-timeframe functions.
Release Notes
- Added alerts for both Buy-side (BSL) and Sell-side (SSL) liquidity levels.Release Notes
- Optimized several functions to enhance script efficiency, resulting in faster calculations and improved performance.- Resolved an issue where lines were being drawn excessively far to the left, causing visual clutter and confusion.
- Improved the overall user experience by streamlining the indicator's operation and reducing unnecessary computations.
Release Notes
- Increased loading speed by incorporating techniques around "request.security" functions to reduce calculations.- Added back monthly timeframes (12M, 6M, 3M, 1M) to the HTF table.
- Added alert to get notified if price taps into equilibrium and activates it.
Release Notes
- Minor table bug fix.Release Notes
Improved HTF Logic: Enhanced the High Time Frame (HTF) analysis for better accuracy and consistency in range identification.Bug Fix: Resolved an issue with alerts where some triggers were not functioning as expected, ensuring reliable and timely notifications.
📥┃𝐅𝐫𝐞𝐞 𝐎𝐮𝐭𝐥𝐨𝐨𝐤𝐬:
discord.gg/B2e52B3D7U
📥┃𝐒𝐰𝐢𝐧𝐠 𝐓𝐫𝐚𝐝𝐢𝐧𝐠 𝐒𝐭𝐫𝐚𝐭𝐞𝐠𝐲 + 𝐁𝐮𝐢𝐥𝐭-𝐢𝐧 𝐈𝐧𝐝𝐢𝐜𝐚𝐭𝐨𝐫:
fractalyst.net/
📥┃ 𝐅𝐫𝐞𝐞 𝐒𝐜𝐫𝐞𝐞𝐧𝐞𝐫:
fractalyst.net/screener
discord.gg/B2e52B3D7U
📥┃𝐒𝐰𝐢𝐧𝐠 𝐓𝐫𝐚𝐝𝐢𝐧𝐠 𝐒𝐭𝐫𝐚𝐭𝐞𝐠𝐲 + 𝐁𝐮𝐢𝐥𝐭-𝐢𝐧 𝐈𝐧𝐝𝐢𝐜𝐚𝐭𝐨𝐫:
fractalyst.net/
📥┃ 𝐅𝐫𝐞𝐞 𝐒𝐜𝐫𝐞𝐞𝐧𝐞𝐫:
fractalyst.net/screener
Disclaimer
The information and publications are not meant to be, and do not constitute, financial, investment, trading, or other types of advice or recommendations supplied or endorsed by TradingView. Read more in the Terms of Use.