OPEN-SOURCE SCRIPT
MILK (My Intraday Lazy Kit)
Updated

I made this script to group information considered useful in forex day trading, of course it can be used on crypto or other markets.
First of all, feel free to suggest any improvement/new feature you would consider interesting for such an use. This is not especially a final version and I'm sure other relevant information can be added in this tool.
Current features are the following
The Clock shows
Price levels names are
Levels width and colors can be modified.
You can also enable/disable the clock, and daily or weekly levels in the options panel.
Nothing more to say for now, I mainly integrated information I like to have, but I'll probably add new features in it if I get some.
First of all, feel free to suggest any improvement/new feature you would consider interesting for such an use. This is not especially a final version and I'm sure other relevant information can be added in this tool.
Current features are the following
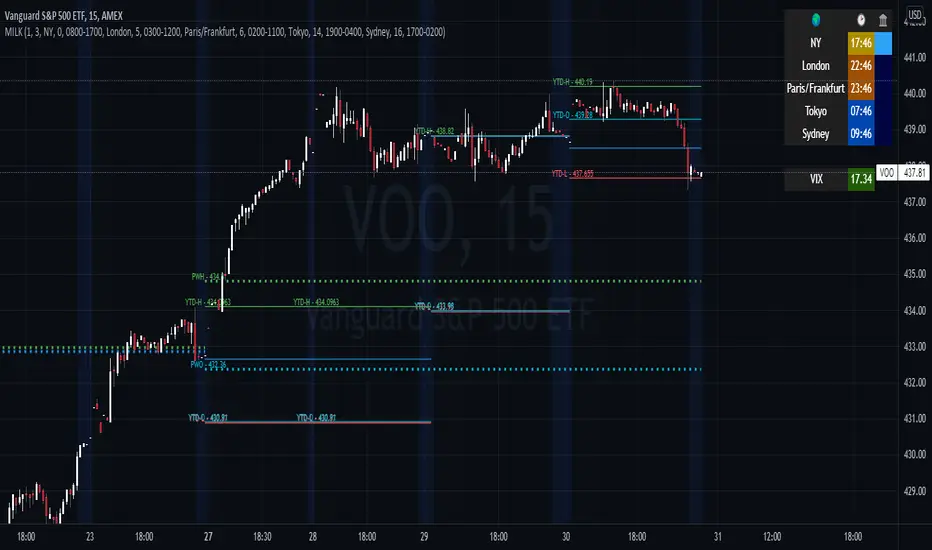
- An international clock showing time and session status (open/closed) for 5 different cities. You can modify it in parameters.
- Drawings of previous days/weeks open/high/low/close prices, which will be often used as supports and resistances zones.
The Clock shows
- City
- Time (with a bgcolor corresponding to the "period" of the day (Morning, Afternoon, Evening, Night)
- Session status (Cyan when the corresponding session is open, blue when it's closed)
Price levels names are
- YTD-H : Yesterday's high
- YTD-L : Yesterday's low
- YTD-C : Yesterday's close
- YTD-O : Yesterday's open
- PWH : Previous week high
- PWL : Previous week low
- PWO : Previous week open
- PWC : Previous week close
Levels width and colors can be modified.
You can also enable/disable the clock, and daily or weekly levels in the options panel.
Nothing more to say for now, I mainly integrated information I like to have, but I'll probably add new features in it if I get some.
Release Notes
Update- Price labels can be disabled
- Daily levels are now hidden above 1D timeframe (can be disabled)
Release Notes
Added the VIX (CBOE S&P 500 Volatility index) to the bottom of the clock (colored from green to red <-> 0 to 100)Open-source script
In true TradingView spirit, the author of this script has published it open-source, so traders can understand and verify it. Cheers to the author! You may use it for free, but reuse of this code in publication is governed by House rules. You can favorite it to use it on a chart.
Disclaimer
The information and publications are not meant to be, and do not constitute, financial, investment, trading, or other types of advice or recommendations supplied or endorsed by TradingView. Read more in the Terms of Use.