OPEN-SOURCE SCRIPT
Welkin Advanced Volume Study (for VSA)
Updated

This is a translation of Welkin's Advanced Volume Study Indicator originally written for ThinkOrSwim. This version is simpler than Welkin's and attempts to streamline that basic functionality for beginners to Volume Spread Analysis.
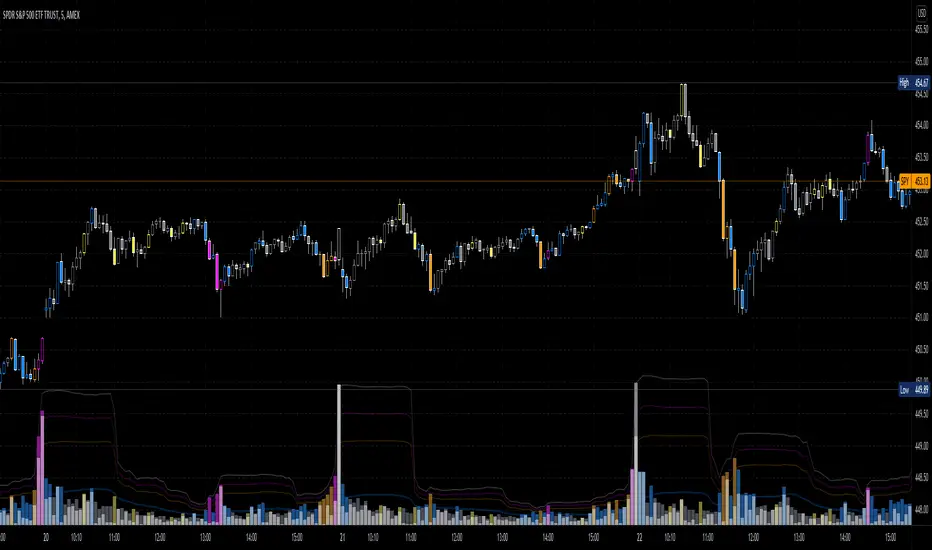
This can be used to replace the built-in volume bar with a more advanced version that is designed to facilitate Volume Spread Analysis. The basic idea is to clearly call out areas of high and low volume that help a trader determine where to "Smart Money" may be attempting to move the market. Volume is an incredible powerful tool for the retail trader; learn how to use it.
Grey bar are Below Average volume .
Blue bars are Average Volume , from a 20sma of volume .
Orange bars are 2-sigma (or 2 standard deviations) above average.
Magenta bars are 3-sigma (3 standard deviations) above average.
The plotted lines represent these levels.
Yellow bars have relatively higher volume compared to the previous bar.
The study can also apply these same colors to the price candles themselves, as well as showing buying and selling pressure of the volume bars.
Release Notes
Fixed bug where 2- and 3- sigma levels didn't update with changes to volume average type.Release Notes
1) Added a sigma-4 level to the possible volume tiers, represented by white bars/candle colors.Release Notes
Added a toggle for the volume moving average plots and cleaned up some color code.Release Notes
Fixed a problem whereby the blue volume average MA didn't hide when intended.Release Notes
Added a toggle for ignoring extended hours when calculating the volume averages.Release Notes
Removed an obsolete settings option and cleaned up some code.If you like this indicator, check out some of my other work here!
Release Notes
- Added tooltips to better explain input options.
- Split volume bar and moving average plot visibility levels and default the MAs to much more transparent to improve readability.
Release Notes
- Upgraded to PineScript v5
- Improved use of "security" function to improve accuracy of higher timeframe buy/sell strength.
Release Notes
- Cleaned up inputs and added more customization options for colors and candle painting.
Open-source script
In true TradingView spirit, the author of this script has published it open-source, so traders can understand and verify it. Cheers to the author! You may use it for free, but reuse of this code in publication is governed by House rules. You can favorite it to use it on a chart.
Thanks for using my indicators; I hope they make you money! Check out the website link for more, and thanks for your support!
Disclaimer
The information and publications are not meant to be, and do not constitute, financial, investment, trading, or other types of advice or recommendations supplied or endorsed by TradingView. Read more in the Terms of Use.