PROTECTED SOURCE SCRIPT
MTF PIVOTS
Updated

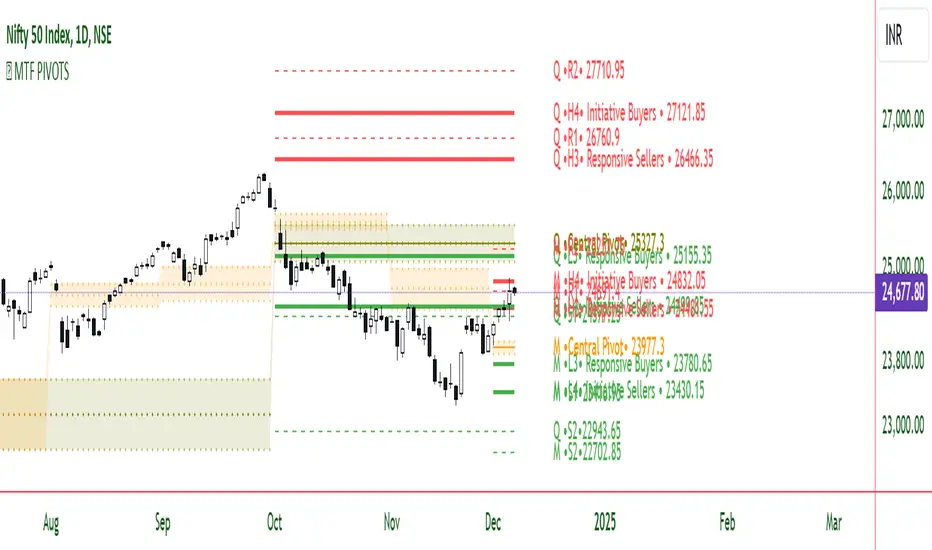
This is a fairly basic (but hopefully useful) indicator that combines three time-frames of Camarilla pivots into one.
Default time-frames are:
Daily
Weekly
Monthly
Quarterly
Yearly
Time-frames can be modified as you wish, they are just set to these as I generally only trade higher intervals (just note that formatting labels will not change - but you can update these as needed).
The Camarilla pivots displayed are as follows:
- H3, L3, H4, L4
- CPR
- CPR Trails ( To find Virgin CPR)
- PREVIOUS HI,LOW , CLOSE
these are more useful for the majority of traders. The formula for levels.
By default all historical pivot levels are not displayed, as there can be some benefit to mapping these forward once the relevant period has ended. But these find too cluttered I'll look into having an option to display the Historical period as well.
What levels are included?
I have used traditional pivot calculation and included Daily, Weekly, Monthly, Quarterly, and Yearly pivots with high and low.
Release Notes
updated for the Traditional pivot points R1-S1 & R2-S2 levels across all the time frames. Happy Trading.
Release Notes
Bugs removed.Release Notes
Bugs removedRelease Notes
bug removedRelease Notes
1 Simple moving average added.3 Pivot based Exponential Moving averages added.
Disclaimer
The information and publications are not meant to be, and do not constitute, financial, investment, trading, or other types of advice or recommendations supplied or endorsed by TradingView. Read more in the Terms of Use.