OPEN-SOURCE SCRIPT
Ultimate RSIs
Updated
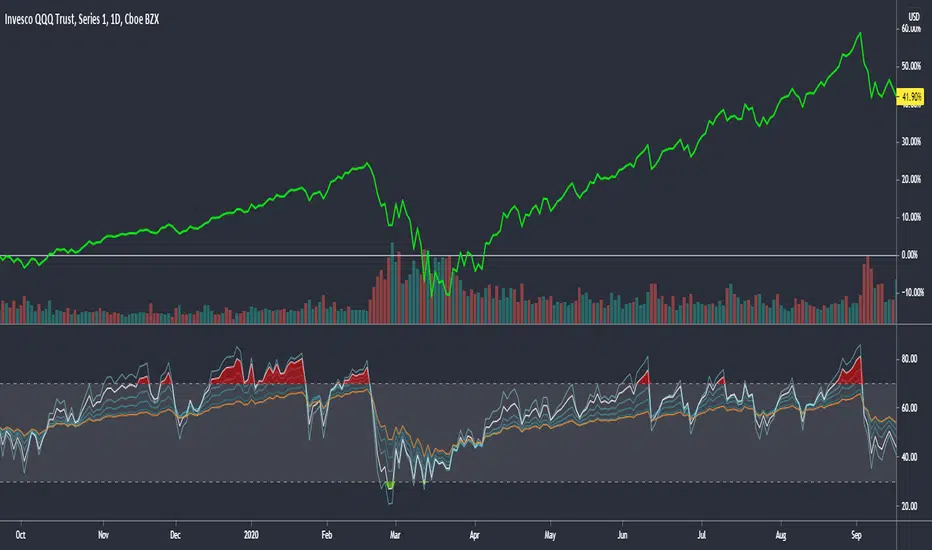
This RSI script includes everything you could want on an RSI. There are multiple timeframes which will give context to market movement, as well as a highlight feature to make it easier to visualize overbought and oversold stocks.
Tip: Uncheck the 4 plots with no color in them to remove the extra headers on the indicator.
Tip: Uncheck the 4 plots with no color in them to remove the extra headers on the indicator.
Release Notes
The values of the default RSIs have been updated to give a more useful contextual view of the market. For example: the orange RSI band is calibrated to reach Overbought within the dotcom bubble on QQQ. If you see a stock with an orange RSI in overbought territory, it should indicate a fall, or a long period of flat returns to cool off.Release Notes
Update is being made to correct the image in order to comply with ToS.Open-source script
In true TradingView spirit, the author of this script has published it open-source, so traders can understand and verify it. Cheers to the author! You may use it for free, but reuse of this code in publication is governed by House rules. You can favorite it to use it on a chart.
Disclaimer
The information and publications are not meant to be, and do not constitute, financial, investment, trading, or other types of advice or recommendations supplied or endorsed by TradingView. Read more in the Terms of Use.