PROTECTED SOURCE SCRIPT
Mansfield Relative Strength Trend
Updated
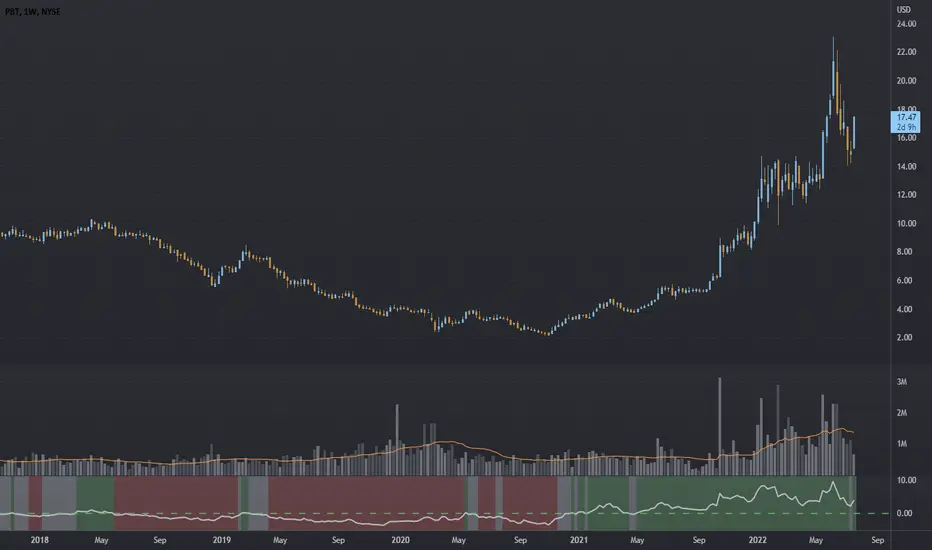
'Stan Weinstein' developed an indicator called Relative Strength which compares the relative strength of a stock with the associated index (in this case the S&P 500).
This indicator combines the relative strength with Weinstein's stage analysis.
The indiacator was made for weekly stock charts only!
BUY & HOLD Conditions (green):
1. Mansfield Relative Strength is above the zero line
2. Price is above the Simple Moving Average (30)
3. Simple Moving Average (30) is rising
SELL & HOLD Conditions (red):
1. Mansfield Relative Strength is below the zero line
2. Price is below the Simple Moving Average (30)
3. Simple Moving Average (30) is falling
It is recommended to end the trade when the trend changes.
Default index is S&P 500, but you can change the index in the settings if you want.
Please always remember, there is no holy grail indicator!
Release Notes
I was told that in the book of Weinstein (page 25) he describes he uses a weighted 30-week moving average (WMA).So in this new version 2.0 I fixed that.
There is a boolean option to choose if you like SMA or WMA.
From the book:
This makes the MA more sensitive to current activity and helps it reverse direction faster. The drawback to their weighted average is that it leads to a few more whipsaws..."
Personally I like the SMA, but this is not in line with the real strategy.
Upper indicator: with WMA
Lower indicator: with SMA
Hope you like it
Best regards
Release Notes
- update to pinescript v5- adding moving average option (most requested feature but disabled per default)
- adding option to set the rs line manually (default 52 on weekly and 200 on daily charts)
Disclaimer
The information and publications are not meant to be, and do not constitute, financial, investment, trading, or other types of advice or recommendations supplied or endorsed by TradingView. Read more in the Terms of Use.