OPEN-SOURCE SCRIPT
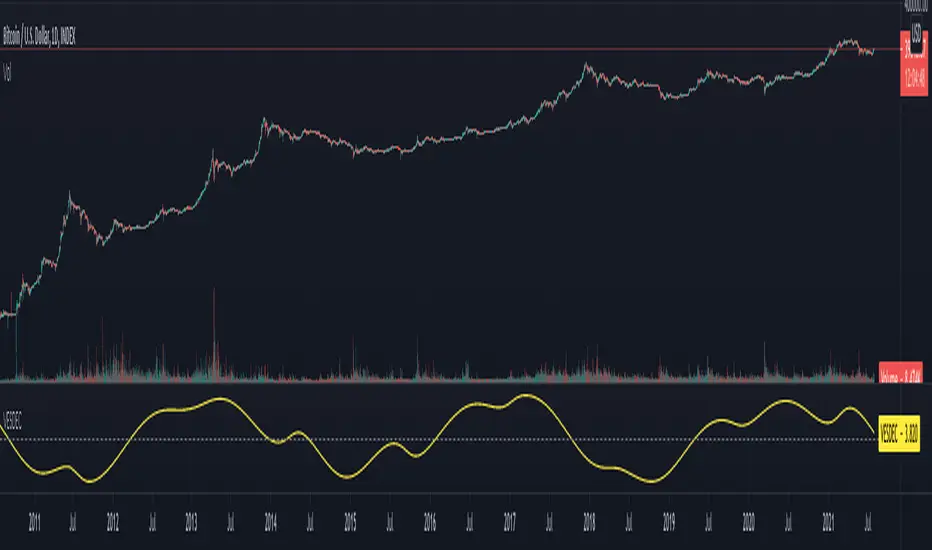
Financial Astrology Vesta Declination

Vesta (asteroid) declination show a strong correlation with the BTCUSD trend, we can clearly see that all the most intense bullish periods have occurred when declination was moving from South to Node direction (when the slope is positive). In the events when declination was moving toward North and have penetrated the zero declination boundary (horizontal dashed line) we can observe a periods where price experienced more volatility.
Note: The Vesta declination indicator is based on an ephemeris array that covers years 2010 to 2030, prior or after this years the data is not available, this daily ephemeris are based on UTC time so in order to align properly with the price bars times you should set UTC as your chart timezone.
Note: The Vesta declination indicator is based on an ephemeris array that covers years 2010 to 2030, prior or after this years the data is not available, this daily ephemeris are based on UTC time so in order to align properly with the price bars times you should set UTC as your chart timezone.
Open-source script
In true TradingView spirit, the author of this script has published it open-source, so traders can understand and verify it. Cheers to the author! You may use it for free, but reuse of this code in publication is governed by House rules. You can favorite it to use it on a chart.
Disclaimer
The information and publications are not meant to be, and do not constitute, financial, investment, trading, or other types of advice or recommendations supplied or endorsed by TradingView. Read more in the Terms of Use.