OPEN-SOURCE SCRIPT
Adaptiv Trend Projection with Dynamic Length Regression
Updated

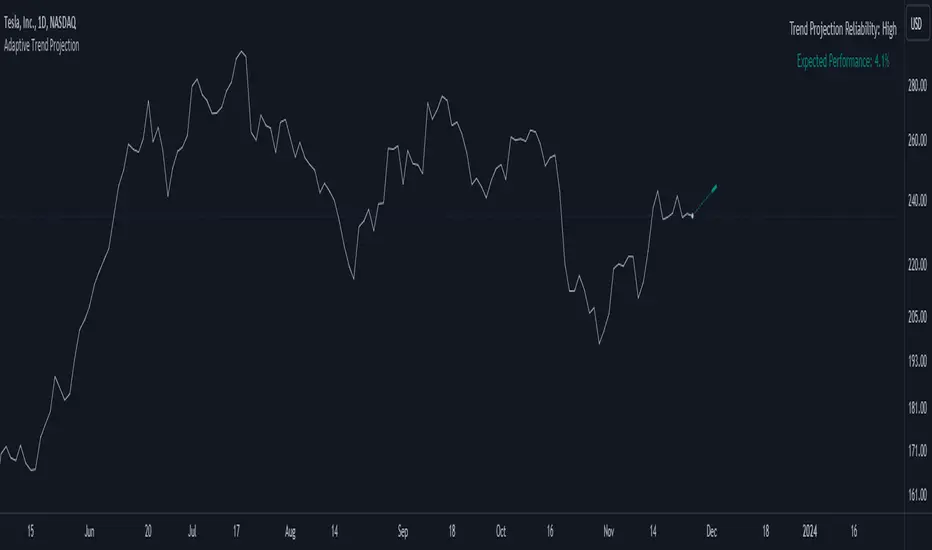
The Adaptive Trend Projection indicator is a robust tool designed to provide an optimal trend projection calculated in a highly sophisticated manner. By utilizing linear regression lengths ranging from 20 to 200, this indicator estimates the duration of the trend by dynamically adjusting the projection length based on the calculated trend's strength.
Key Features:
1. Dynamic Length Adjustment: The indicator intelligently adapts the projection length between 20 and 200 using linear regression, ensuring adaptability to market conditions.
2. Trend Strength Calculation: Through linear regression analysis, the indicator calculates the slope, average, and intercept for each selected length, providing insights into the strength and direction of the trend.
3. Deviation Analysis: Beyond traditional trend analysis, the indicator calculates standard deviation, Pearson's correlation coefficient, and deviation values, offering a comprehensive view of market dynamics.
4. Confidence Levels: A unique feature of the Adaptive Trend Projection is its ability to determine confidence levels based on the highest Pearson's R value. Reliability is categorized into levels such as Neutral, Moderate, High, Very High, and Ultra High, providing users with a quick assessment of the projection's robustness.
5. Dynamic Forecasting: The indicator not only analyzes historical data but extends its functionality by dynamically forecasting future trend points. The projection adjusts in length based on the strength of the trend, allowing for more accurate predictions.
6. Visual Clarity: Enhancing visual clarity, the Adaptive Trend Projection indicator uses different line styles, widths, and colors to highlight crucial points, making it easier for traders to interpret and act upon the information.
In conclusion, the Adaptive Trend Projection indicator offers a nuanced understanding of market trends by combining advanced linear regression techniques, deviation analysis, and confidence level assessments. This enables traders to make informed decisions.
Release Notes
Minor modificationRelease Notes
Expected Performance AddedRelease Notes
Minor Update: Style options addedRelease Notes
Bug fixedOpen-source script
In true TradingView spirit, the author of this script has published it open-source, so traders can understand and verify it. Cheers to the author! You may use it for free, but reuse of this code in publication is governed by House rules. You can favorite it to use it on a chart.
Disclaimer
The information and publications are not meant to be, and do not constitute, financial, investment, trading, or other types of advice or recommendations supplied or endorsed by TradingView. Read more in the Terms of Use.