OPEN-SOURCE SCRIPT
Vortex Range Breakout System
This is a Vortex Based Visual System,
Which can help you identify the Vortex Crosses based Range Breakouts/ Breakdown, over the price Scale,
How its made ?
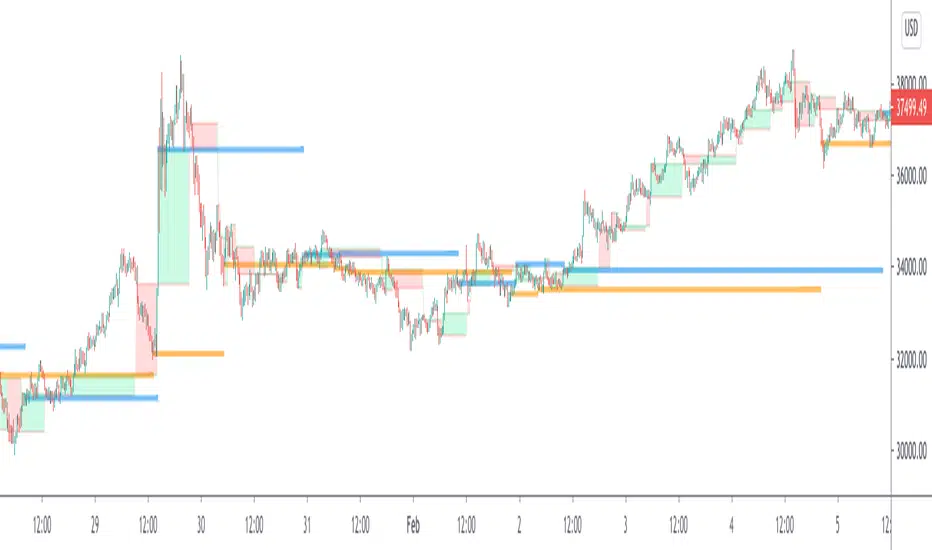
The vortex Crosses are projected over the Price
on Same Time frame {Green and Red Filled area}
-> green Area means : Vortex Crossover Range
-> red Area means : Vortex Crossunder Range
and on Higher Timeframe
Vortex Cross Levels are Plotted, which you see as :
Blue and Orange Lines
Default Configs
Vortex Period is 14
Higher Timeframe Option is set to 60 mins
You can change the Higher timeframe to any minutes which suits your need
Also If you want to change the Higher Timeframe in Days
just know
1D = 24*60 min, = 1140mins
Enjoy!
Which can help you identify the Vortex Crosses based Range Breakouts/ Breakdown, over the price Scale,
How its made ?
The vortex Crosses are projected over the Price
on Same Time frame {Green and Red Filled area}
-> green Area means : Vortex Crossover Range
-> red Area means : Vortex Crossunder Range
and on Higher Timeframe
Vortex Cross Levels are Plotted, which you see as :
Blue and Orange Lines
Default Configs
Vortex Period is 14
Higher Timeframe Option is set to 60 mins
You can change the Higher timeframe to any minutes which suits your need
Also If you want to change the Higher Timeframe in Days
just know
1D = 24*60 min, = 1140mins
Enjoy!
Get Ocs Ai Trader, Your personal Ai Trade Assistant here
→ ocstrader.com
→ bit.ly/ocs_ai_trader
About me
AlgoTrading Certification, (University of Oxford, Säid Business School)
PGP Research Analysis, (NISM)
Electronics Engineer
→ ocstrader.com
→ bit.ly/ocs_ai_trader
About me
AlgoTrading Certification, (University of Oxford, Säid Business School)
PGP Research Analysis, (NISM)
Electronics Engineer
Open-source script
In true TradingView spirit, the author of this script has published it open-source, so traders can understand and verify it. Cheers to the author! You may use it for free, but reuse of this code in publication is governed by House rules. You can favorite it to use it on a chart.
Disclaimer
The information and publications are not meant to be, and do not constitute, financial, investment, trading, or other types of advice or recommendations supplied or endorsed by TradingView. Read more in the Terms of Use.