PROTECTED SOURCE SCRIPT
RSI vs Stochastic vs Stochastic RSI
Updated
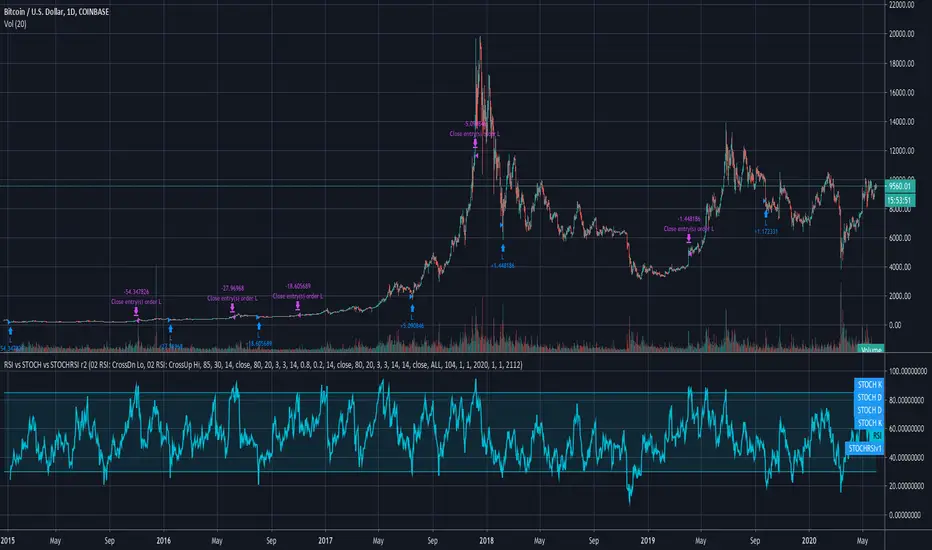
To compare each indicator's performance toggle between the various buy and sell methods while watching results in the Strategy Tester pane.
OSC = Oscillates between crossing the chosen Lo or Hi levels for either RSI or Stochastic/Stochastic RSI.
CROSS = When the Stochastic or Stochastic RSI k crosses d.
Outer gray band equals Stochastic/StochasticRSI range.
Inner gray band equals RSI range.
NOTICE: This script does not require access from me, simply open Indicators on chart and search for "RSI vs Stochastic vs Stochastic RSI". By accessing this script you acknowledge that you have read and understood that this is for research purposes only and I am not responsible for any financial losses you may incur by using this script!
Release Notes
Revision 2Added all possible combinations.
Added numerals to list of methods.
Release Notes
Revision 2 (typo above - should have been Revision 1 )Added original Stochastic RSI indicator by Tushar S. Chande, in (1994) "The New Technical Trader" and "Stocks & Commodities V. 11:05: Stochastic RSI And Dynamic Momentum Index".
NOTE: The original Stochastic RSI indicator oscillates between 0 and 1. It's plot has been multiplied by 100 only for viewing at same scale as other indicators.
Added dedicated variables for each indicator.
Added plot colors for each indicator.
Added option to toggle fill colors.
Release Notes
Revision 3Added Auto Date Range. Renamed OSC method choices to CrossUp / CrossDn to more clearly denote direction. Updated to Pine v4.
lux ex tenebris • deuro mea umbra absens • Telegram: t.me/allanster
Disclaimer
The information and publications are not meant to be, and do not constitute, financial, investment, trading, or other types of advice or recommendations supplied or endorsed by TradingView. Read more in the Terms of Use.