PROTECTED SOURCE SCRIPT
BTC Active Address Momentum (On-chain)
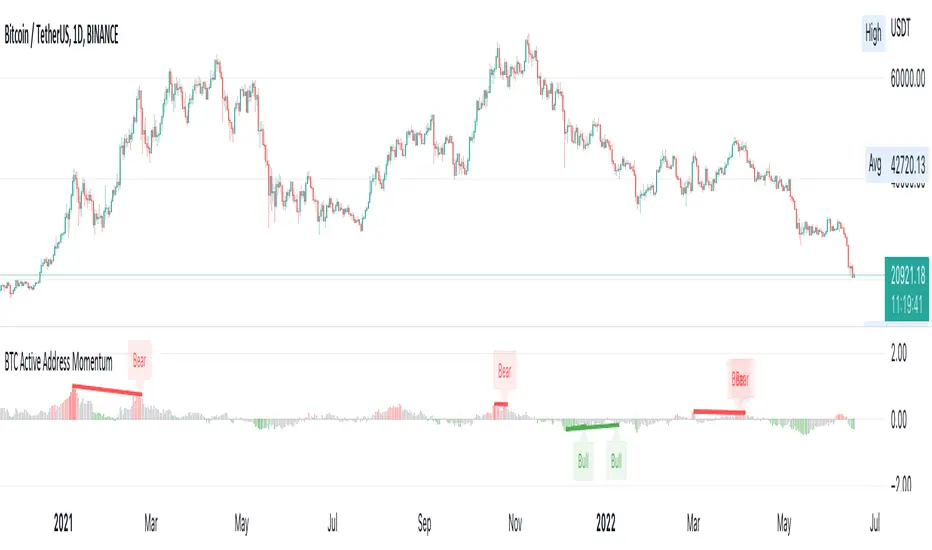
This indicator shows the difference between the % change in BTC price and the % change in BTC’s active addresses (BTC’s utility value).
- Dark red: Extreme overbought conditions
BTC price is increasing too fast and outgrows the increase in its utility value
(RSI of % change difference > 70)
- Light red: Overbought conditions
BTC price is increasing too fast and outgrows the increase in its utility value
(RSI of % change difference > 60)
- Dark green: Extreme oversold conditions
BTC price is dropping too fast and outruns the decrease in its utility value
(RSI of % change difference < 30)
- Light green: Oversold conditions
BTC price is dropping too fast and outruns the decrease in its utility value
(RSI of % change difference < 40)
*Not financial advice.
Building the future global economic system
Disclaimer
The information and publications are not meant to be, and do not constitute, financial, investment, trading, or other types of advice or recommendations supplied or endorsed by TradingView. Read more in the Terms of Use.