OPEN-SOURCE SCRIPT
Best Volatility Calculator (Multi Instruments)
Hello traders
A bit of context
Definition: Volatility is defined as the close of current candle - close of the previous N candle
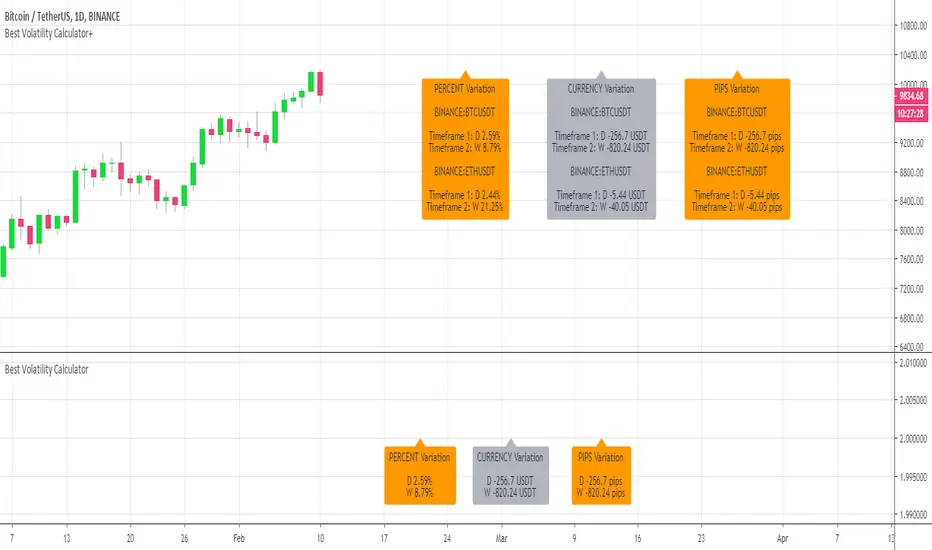
This is an alternative version of my Best Volatility Calculator
The other version is displayed on a panel below. This one overlays on the chart using the "overlay=true" setting
This indicator shows the average volatility, of last N Periods, for the selected time frames and for 2 selected instruments.
You can select up to 2 timeframes with this version
Presented as Currency, Pip, percentage labels in a panel below.
Will calculate in real-time only for the current instrument on the chart.
The indicator is coded to not be repainting
Example
In the indicator screenshot, I used a lookback period of 1.
That compares the current candle close versus the previous one for the daily and weekly timeframe
Showing how the results look like using FOREX instruments (where using the PIPS labels make more sense than with cryptocurrency assets)

Best regards
Dave
A bit of context
Definition: Volatility is defined as the close of current candle - close of the previous N candle
This is an alternative version of my Best Volatility Calculator
The other version is displayed on a panel below. This one overlays on the chart using the "overlay=true" setting
This indicator shows the average volatility, of last N Periods, for the selected time frames and for 2 selected instruments.
You can select up to 2 timeframes with this version
Presented as Currency, Pip, percentage labels in a panel below.
Will calculate in real-time only for the current instrument on the chart.
The indicator is coded to not be repainting
Example
In the indicator screenshot, I used a lookback period of 1.
That compares the current candle close versus the previous one for the daily and weekly timeframe
Showing how the results look like using FOREX instruments (where using the PIPS labels make more sense than with cryptocurrency assets)
Best regards
Dave
👨💻 Need help you with your FTMO/TopStep verif?
⭐️ Listed as TradingView Trusted Pine Programmer
📧 dave@best-trading-indicator
Telegram: Daveatt
⏩ Course: best-trading-indicator.com
Twitter: twitter.com/bti_trading
⭐️ Listed as TradingView Trusted Pine Programmer
📧 dave@best-trading-indicator
Telegram: Daveatt
⏩ Course: best-trading-indicator.com
Twitter: twitter.com/bti_trading
Open-source script
In true TradingView spirit, the author of this script has published it open-source, so traders can understand and verify it. Cheers to the author! You may use it for free, but reuse of this code in publication is governed by House rules. You can favorite it to use it on a chart.
Disclaimer
The information and publications are not meant to be, and do not constitute, financial, investment, trading, or other types of advice or recommendations supplied or endorsed by TradingView. Read more in the Terms of Use.