OPEN-SOURCE SCRIPT
GMS: Market Performance Indicator
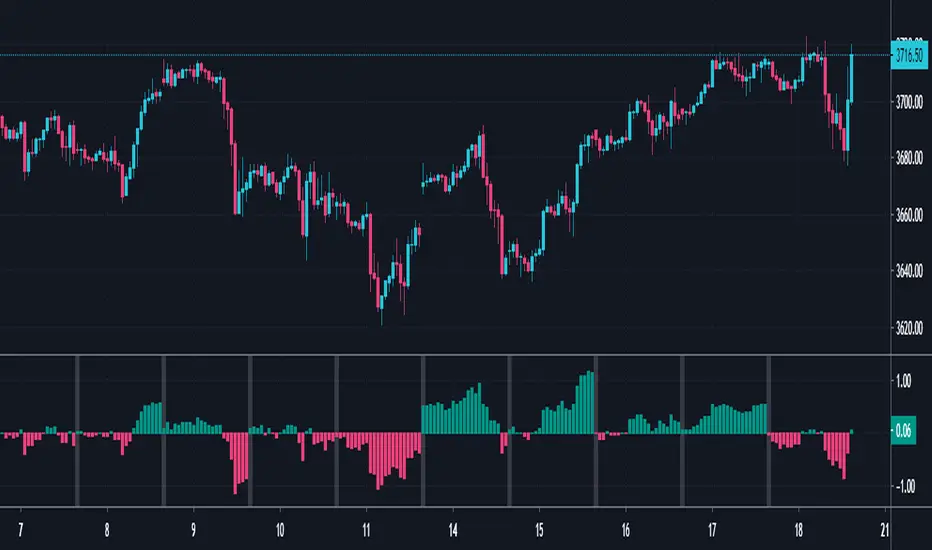
This is just an easy way to visualize what the market's performance is (in price or percent) in any given session for any chosen time frame. The magnitude of price moves are not the same today as they were 50 years ago, which is why I included the percent selection to better compare historical movements. Time frame selections are Daily, Weekly, Monthly, Quarterly, and Yearly. I added in a little background highlight to show the start of a new session as well.
The source code is open so feel free to poke around!
Hope this helps,
Andre
The source code is open so feel free to poke around!
Hope this helps,
Andre
Open-source script
In true TradingView spirit, the author of this script has published it open-source, so traders can understand and verify it. Cheers to the author! You may use it for free, but reuse of this code in publication is governed by House rules. You can favorite it to use it on a chart.
Disclaimer
The information and publications are not meant to be, and do not constitute, financial, investment, trading, or other types of advice or recommendations supplied or endorsed by TradingView. Read more in the Terms of Use.