OPEN-SOURCE SCRIPT
Global Liquidity Index and DEMA100

1. Global Liquidity Index:
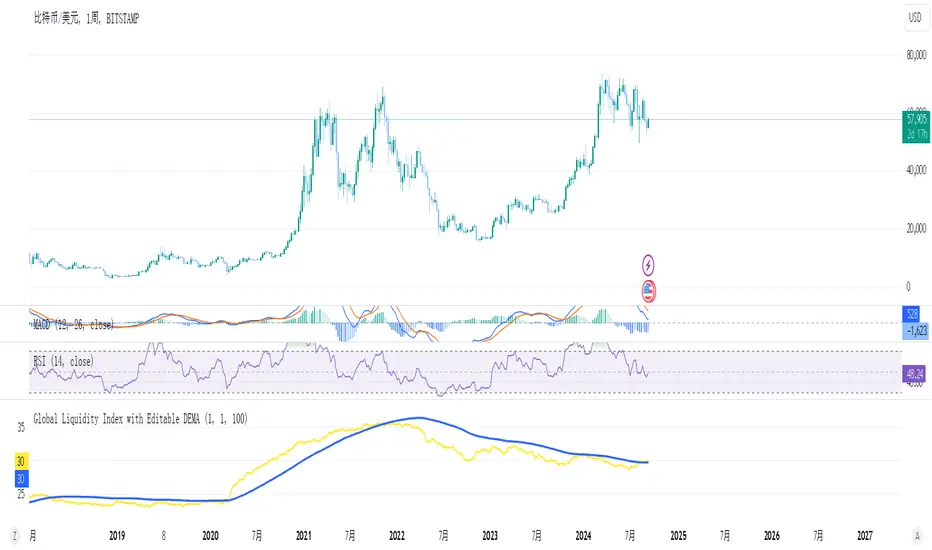
The code calculates global liquidity from economic data from multiple countries and regions. Specifically, it aggregates money supply data from major economies such as the United States, Europe, China, and Japan, and sums and adjusts them to get a global liquidity index.
This index is calculated by summing data from different sources and subtracting the impact of some financial instruments (such as reverse repurchase agreements, etc.), and then converting the result into a number in trillions. This can help analyze the liquidity conditions in global money markets.
2. ROC SMA (Simple Moving Average of Rate of Change):
The code calculates the rate of change (ROC) of the global liquidity index, which is a way to measure the speed of change of the index.
Then, a simple moving average (SMA) is applied to the rate of change, which helps smooth the data and identify trends.
The ROC SMA curve is displayed in yellow to help users observe the trend of liquidity changes.
3. DEMA (Double Exponential Moving Average):
DEMA is a more complex moving average that attempts to reduce the lag of the moving average and provide a more sensitive trend response.
The calculation method is to first calculate a standard exponential moving average (EMA), then calculate the EMA of this EMA, and use these two results to calculate DEMA.
The code allows users to set the period length of DEMA (default is 100), which can adjust the speed of DEMA's response to price changes.
The DEMA curve is displayed in blue, helping users to more accurately capture the trends and changes of global liquidity indicators.
Open-source script
In true TradingView spirit, the author of this script has published it open-source, so traders can understand and verify it. Cheers to the author! You may use it for free, but reuse of this code in publication is governed by House rules. You can favorite it to use it on a chart.
Disclaimer
The information and publications are not meant to be, and do not constitute, financial, investment, trading, or other types of advice or recommendations supplied or endorsed by TradingView. Read more in the Terms of Use.