OPEN-SOURCE SCRIPT
Zweig Market Breadth Thrust Indicator [LazyBear]
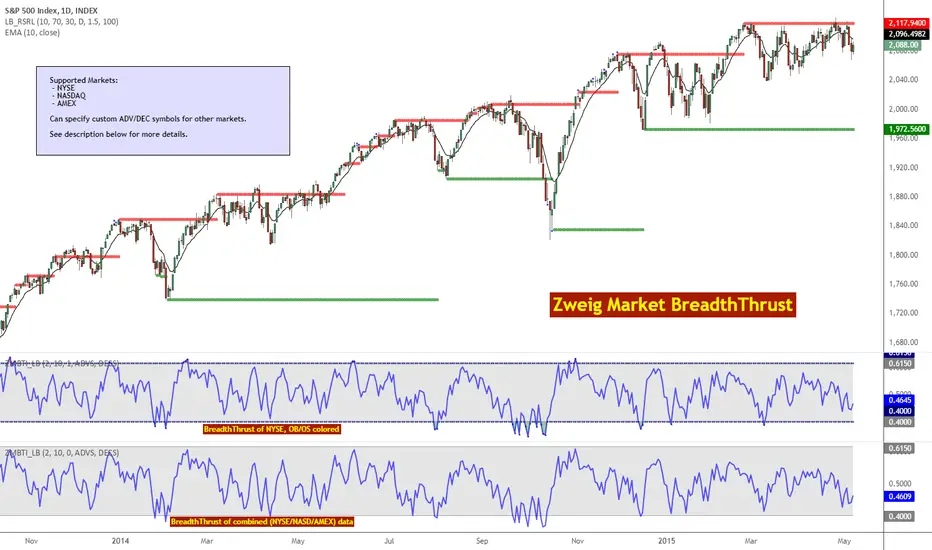
The Breadth Thrust (BT) indicator is a market momentum indicator developed by Dr. Martin Zweig. According to Dr. Zweig a Breadth Thrust occurs when, during a 10-day period, the Breadth Thrust indicator rises from below 40 percent to above 61.5 percent.
A "Thrust" indicates that the stock market has rapidly changed from an oversold condition to one of strength, but has not yet become overbought. This is very rare and has happened only a few times. Dr. Zweig also points out that most bull markets begin with a Breadth Thrust.
All parameters are configurable. You can draw BT for NYSE, NASDAQ, AMEX or based on combined data (i.e., AMEX+NYSE+NASD). There is also a "CUSTOM" mode supported, so you can enter your own ADV/DEC symbols.
More info:
Definition: investopedia.com/terms/b/breadth-thrust-indicator.asp
A Breadth Thrust Signal: mcoscillator.com/learning_center/weekly_chart/a_breadth_thrust_signal/
A Rare "Zweig" Buy Signal: moneyshow.com/articles.asp?aid=GURU-39533
Zweig Breadth Thrust: recessionalert.com/zweig-breadth-thrust-redux/
List of my public indicators: bit.ly/1LQaPK8
List of my app-store indicators: blog.tradingview.com/?p=970
List of my free indicators: bit.ly/1LQaPK8
List of my indicators at Appstore: blog.tradingview.com/?p=970
List of my indicators at Appstore: blog.tradingview.com/?p=970
Open-source script
In true TradingView spirit, the author of this script has published it open-source, so traders can understand and verify it. Cheers to the author! You may use it for free, but reuse of this code in publication is governed by House rules. You can favorite it to use it on a chart.
Disclaimer
The information and publications are not meant to be, and do not constitute, financial, investment, trading, or other types of advice or recommendations supplied or endorsed by TradingView. Read more in the Terms of Use.