OPEN-SOURCE SCRIPT
FX Index Curve Oscillator (FICO)
We can approximate the  DXY with simple multiplication, rather than using geometric weighted averages; the values will be different, but the charts will look almost the same. Because we can make a "good enough" version of DXY, we can also extend this concept to the other major currencies:
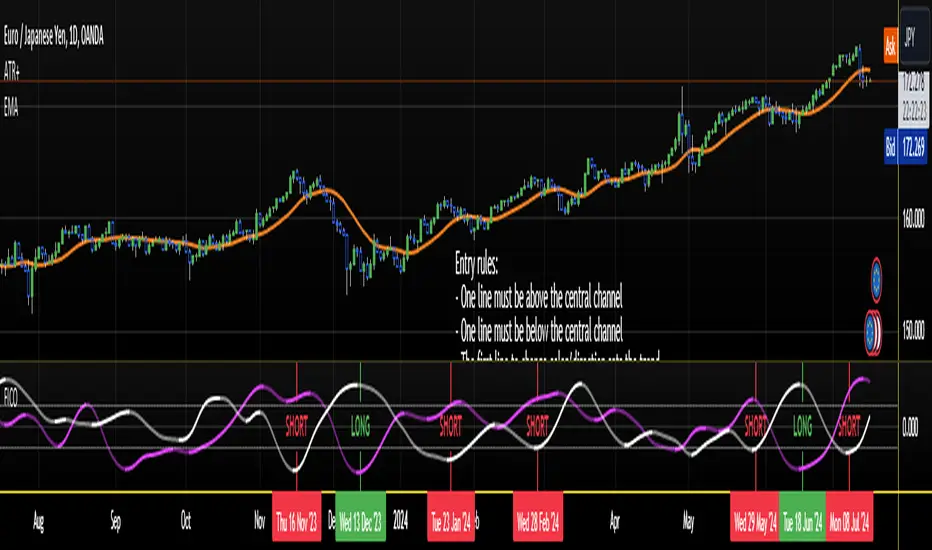
This indicator works by constructing an "index" for each currency, performing a lookback to figure out the rate of change, and then smoothing the values. These values are fed through an oscillator to normalize them between -1.00 and +1.00, before finally being smoothed again. Interestingly, using HMA to smooth them the second time will cause the values to leak past 1.00, which we can also use as a signal.
If you want to change the values, I find that the biggest difference comes from the lookback and oscillator settings; the MA/smoothing is probably good enough. The default settings are for doing forex trades on the daily chart. Other timeframes are possible, but I could not find any settings that work. It might also be possible to use a similar approach on other assets (crypto, metals, indexes, etc) but I have not tried yet.
In my own testing, what I found to be a good approach is to look for a currency to be above +1 and another to be below -1, and then look for color changes; ideally this will happen on the same bar/candle.
You can also consider two line crosses, breaking above or below 1, etc as other entry signals. I find that price will either move immediately, or take a candle or two to retrace and then start moving.
Happy trading!
Unfortunately, the indicator pane can get quite crowded; if you're testing for a single currency pair, you may want to disable some of the plotted lines:

- AUD - Yellow
- CAD - Red
- CHF - Orange
- EUR - Purple
- GBP - Green
- JPY - White
- NZD - Lime green
- USD - Blue
This indicator works by constructing an "index" for each currency, performing a lookback to figure out the rate of change, and then smoothing the values. These values are fed through an oscillator to normalize them between -1.00 and +1.00, before finally being smoothed again. Interestingly, using HMA to smooth them the second time will cause the values to leak past 1.00, which we can also use as a signal.
If you want to change the values, I find that the biggest difference comes from the lookback and oscillator settings; the MA/smoothing is probably good enough. The default settings are for doing forex trades on the daily chart. Other timeframes are possible, but I could not find any settings that work. It might also be possible to use a similar approach on other assets (crypto, metals, indexes, etc) but I have not tried yet.
In my own testing, what I found to be a good approach is to look for a currency to be above +1 and another to be below -1, and then look for color changes; ideally this will happen on the same bar/candle.
You can also consider two line crosses, breaking above or below 1, etc as other entry signals. I find that price will either move immediately, or take a candle or two to retrace and then start moving.
Happy trading!
Unfortunately, the indicator pane can get quite crowded; if you're testing for a single currency pair, you may want to disable some of the plotted lines:
Open-source script
In true TradingView spirit, the author of this script has published it open-source, so traders can understand and verify it. Cheers to the author! You may use it for free, but reuse of this code in publication is governed by House rules. You can favorite it to use it on a chart.
Disclaimer
The information and publications are not meant to be, and do not constitute, financial, investment, trading, or other types of advice or recommendations supplied or endorsed by TradingView. Read more in the Terms of Use.