OPEN-SOURCE SCRIPT
MACD-V
Updated
What is it?
The MACD-V indicator is the normal version of the MACD (Moving Average Convergence Divergence) indicator but normalized for volatility. It is normalized for volatility in order to compare momentum values across time and across tickers which the normal MACD indicator fails to do.
Formula
The formula for the MACD-V is as follows
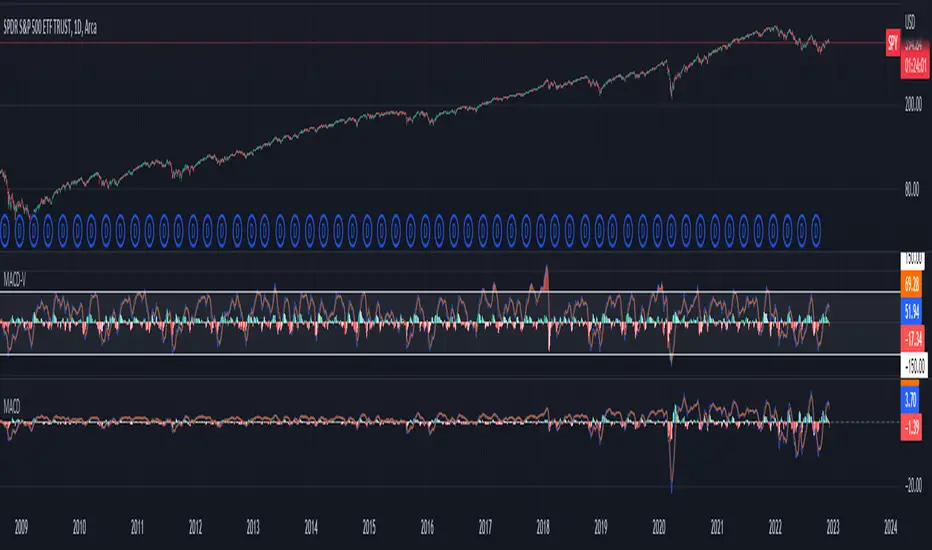
How to Use
The MACD-V indicator is used to analyze normalized trends. If the MACD line is above 150, it is considered overbought. If the MACD line is below -150, it is considered oversold. Crossovers of the MACD line and the signal line are considered to be points of trend changes as well.
Features
Credits
All credit for the idea behind this indicator goes to Alex Spiroglou CMT. His academic paper on the indicator can be found here.
In addition to Alex's idea for the paper, one TradingView user, Mik3Christ3ns3n has created a partial version of it which can be found here.
The MACD-V indicator is the normal version of the MACD (Moving Average Convergence Divergence) indicator but normalized for volatility. It is normalized for volatility in order to compare momentum values across time and across tickers which the normal MACD indicator fails to do.
Formula
The formula for the MACD-V is as follows
- MACD Line = [[EMA(12,close) - EMA(26,close)] / ATR(26)] * 100
- Signal Line = EMA(9,MACD)
- Histogram = MACD Line - Signal Line
How to Use
The MACD-V indicator is used to analyze normalized trends. If the MACD line is above 150, it is considered overbought. If the MACD line is below -150, it is considered oversold. Crossovers of the MACD line and the signal line are considered to be points of trend changes as well.
Features
- Customizable Overbought/Oversold boundaries
- Customizable colors
Credits
All credit for the idea behind this indicator goes to Alex Spiroglou CMT. His academic paper on the indicator can be found here.
In addition to Alex's idea for the paper, one TradingView user, Mik3Christ3ns3n has created a partial version of it which can be found here.
Release Notes
12/8/2022 Changes:- Extended oversold and overbought boundaries forward to make it look nicer.
Open-source script
In true TradingView spirit, the author of this script has published it open-source, so traders can understand and verify it. Cheers to the author! You may use it for free, but reuse of this code in publication is governed by House rules. You can favorite it to use it on a chart.
Disclaimer
The information and publications are not meant to be, and do not constitute, financial, investment, trading, or other types of advice or recommendations supplied or endorsed by TradingView. Read more in the Terms of Use.